Moving Average Indicator: The Complete Guide — SMA, EMA, WMA, VWMA & TradingView Setup
A professional, in-depth guide to Moving Average indicators — covering the history, types (SMA, EMA, WMA, VWMA, DEMA, TEMA, HMA), how each works, trading signals, and a full step-by-step walkthrough to add and configure Moving Averages on TradingView.

What Is a Moving Average?
A Moving Average is a statistical calculation that smooths out price data over a specified number of periods to create a continuously updated average price line on a chart. Instead of looking at every single price bar — which can be noisy and erratic — a moving average filters out short-term fluctuations and reveals the underlying trend direction more clearly.
The word moving refers to the fact that as each new price bar forms, the oldest price is dropped from the calculation and the newest price is added — so the average continuously moves forward with time.
"If you could only use one tool in technical analysis for the rest of your trading career, a moving average would be the most defensible choice. It is the backbone of trend identification in every market on earth."
Moving averages serve three primary purposes: identifying the direction of the trend, measuring the strength of the trend, and providing dynamic support and resistance levels that price tends to respect repeatedly.
History of Moving Averages
Origins in Statistics and Economics
The concept of averaging a series of data points over time dates back centuries in mathematics and statistics. However, the application of moving averages to financial price data began gaining traction in the early 20th century. Early stock market analysts and economists started using simple averages of price data to identify the underlying direction of commodity and stock prices, strip away daily volatility, and make longer-term forecasts.
The earliest documented use of moving averages specifically for stock market analysis is attributed to analysts working in the 1920s and 1930s, when financial journalism and early chartism were beginning to emerge as systematic disciplines. Richard Donchian, often called the father of trend following, was among the pioneers who incorporated moving averages into systematic trading rules in the 1930s and 1940s.
Popularization Through the Dow Theory Era
During the mid-20th century, as technical analysis grew as a discipline — particularly following the publication of "Technical Analysis of Stock Trends" by Robert D. Edwards and John Magee in 1948 — moving averages became a standard tool. The 200-day Simple Moving Average gained special prominence during this era as a long-term trend barometer for stocks, a role it retains to this day.
The EMA Revolution — 1960s to 1970s
The Exponential Moving Average was developed as a response to a key limitation of the SMA — its equal weighting of all periods. In the 1960s, mathematicians and financial analysts developed the EMA formula, which applies exponentially decreasing weights to older data so that the most recent price changes have a greater impact on the moving average. This made EMAs far more responsive to current market conditions without being as noisy as a raw price chart.
The rise of programmable calculators and early computers in the 1970s made it practical to calculate EMAs in real time, and they quickly became a standard tool for professional traders and analysts.
Gerald Appel and the MACD Connection
When Gerald Appel created the MACD indicator in 1979, he built it entirely from Exponential Moving Averages — cementing the EMA's importance and bringing the concept of dual moving average systems to mainstream trading audiences worldwide.
Modern Era — Advanced MAs and Algorithmic Trading
From the 1980s onward, as personal computers became widespread and charting software democratized technical analysis, a wave of new moving average types emerged. Patrick Mulloy introduced the DEMA and TEMA in a 1994 Stocks and Commodities Magazine article. Alan Hull introduced the Hull Moving Average (HMA) in 2005, specifically designed to reduce lag while maintaining smoothness. Volume-weighted variants like VWMA also gained popularity as traders sought to incorporate volume context into trend analysis.
Today, moving averages are embedded in every algorithmic trading system, every quantitative hedge fund strategy, and every retail trading platform worldwide — making them the single most universally applied concept in all of market analysis.
| Era | Milestone |
|---|---|
| 1920s–1930s | First documented use of MA in stock market analysis; Richard Donchian pioneers trend following |
| 1948 | Edwards and Magee publish "Technical Analysis of Stock Trends"; 200-day SMA gains prominence |
| 1960s | Exponential Moving Average (EMA) formula developed and adopted |
| 1970s | Computers make real-time EMA calculation practical for traders |
| 1979 | MACD (built on EMAs) introduced by Gerald Appel; EMAs go mainstream |
| 1994 | Patrick Mulloy introduces DEMA and TEMA in Stocks and Commodities Magazine |
| 2005 | Alan Hull introduces the Hull Moving Average (HMA) |
| Present | MAs are universal — embedded in every trading platform and algorithmic system globally |
Why Are Moving Averages Useful?
1. Identify Trend Direction Instantly
The most fundamental use of a moving average is to determine which direction the market is trending. When price is consistently trading above a moving average, the trend is up. When price is consistently below the moving average, the trend is down. This single rule — applied consistently — keeps traders on the right side of the market the vast majority of the time.
2. Act as Dynamic Support and Resistance
Unlike horizontal support and resistance lines, moving averages move with price — creating dynamic support and resistance levels that adapt to changing market conditions. Major moving averages like the 20 EMA, 50 SMA, and 200 SMA are widely watched by institutional traders, making them self-fulfilling levels where price frequently bounces or reacts.
3. Generate Crossover Signals
When two moving averages of different periods are plotted together, their crossovers generate clear, objective buy and sell signals. The famous Golden Cross (short MA crosses above long MA) and Death Cross (short MA crosses below long MA) are among the most followed trading signals in the world.
4. Smooth Out Noise
Daily price action is full of random fluctuations, gaps, and volatility spikes that can mislead traders. Moving averages filter this noise and present a cleaner view of the underlying price trend — making it much easier to see what the market is actually doing versus short-term randomness.
5. Versatile Across All Markets and Timeframes
Moving averages work on every financial instrument — stocks, indices, forex, crypto, commodities, ETFs — and on every timeframe from 1-minute charts to monthly charts. Their universality is unmatched by any other technical tool.
6. Foundation for Other Indicators
Moving averages are the building blocks of dozens of other popular indicators — MACD, Bollinger Bands, Ichimoku Cloud, Keltner Channels, and more. Understanding MAs deeply means understanding the foundation of half the indicators in any trader's toolkit.
Types of Moving Averages — Overview
Not all moving averages are created equal. Different types apply different mathematical weighting schemes to price data, resulting in lines with different levels of smoothness, lag, and responsiveness. Here is a complete breakdown of every major type:
| Type | Abbreviation | Weighting | Lag | Smoothness | Best For |
|---|---|---|---|---|---|
| Simple Moving Average | SMA | Equal weight to all periods | High | Very Smooth | Long-term trend, support/resistance |
| Exponential Moving Average | EMA | More weight to recent prices | Medium | Smooth | Trend following, crossovers, MACD |
| Weighted Moving Average | WMA | Linear weight, most recent highest | Medium-Low | Moderate | Short-term trend, faster signals |
| Volume Weighted Moving Average | VWMA | Weighted by volume | Medium | Smooth | Intraday trading, institutional levels |
| Double Exponential Moving Average | DEMA | Double EMA calculation | Low | Moderate | Faster trend detection |
| Triple Exponential Moving Average | TEMA | Triple EMA calculation | Very Low | Less Smooth | Very fast signals, volatile markets |
| Hull Moving Average | HMA | WMA-based, lag-reduced formula | Very Low | Smooth | Best balance of speed and smoothness |
Simple Moving Average (SMA)
What Is SMA?
The Simple Moving Average is the most basic form of a moving average. It calculates the arithmetic mean of a specified number of closing prices — treating every price in the lookback period with equal weight.
SMA Formula
SMA = (P1 + P2 + P3 + ... + Pn) ÷ n
Where P is the closing price of each period and n is the total number of periods selected.
For example, a 10-period SMA adds the last 10 closing prices and divides by 10. When the 11th bar forms, the oldest price is dropped and the newest is added — maintaining a constant 10-period window.
Most Popular SMA Periods
- 20 SMA: Short-term trend, approximately one trading month on daily charts
- 50 SMA: Medium-term trend, widely watched by institutions and funds
- 100 SMA: Longer-term trend filter used by position traders
- 200 SMA: The most important long-term trend indicator in all of stock market analysis — when price is above 200 SMA the long-term trend is up; below it the trend is down
Strengths of SMA
- Extremely smooth line — reduces noise effectively
- Easy to calculate and understand
- Highly respected at key levels (50, 200) by institutional traders
- Excellent for identifying long-term trend direction
Weaknesses of SMA
- High lag — slow to react to sudden price changes
- Treats a price from 200 days ago with the same weight as yesterday's price
- Can generate late signals in fast-moving markets
Exponential Moving Average (EMA)
What Is EMA?
The Exponential Moving Average applies a multiplier (weighting factor) to recent prices so that the most recent data has a greater influence on the moving average value than older data. This makes EMA significantly more responsive to recent price changes than the SMA, while still maintaining a degree of smoothing.
EMA Formula
Multiplier (k) = 2 ÷ (Period + 1)EMA = (Current Close × k) + (Previous EMA × (1 − k))
For a 12-period EMA, the multiplier is 2 ÷ (12 + 1) = 0.1538 — meaning the current price contributes approximately 15.38% to the new EMA value. For a 26-period EMA, the multiplier is 2 ÷ (26 + 1) = 0.0741 — meaning only about 7.4% of the new EMA comes from the current price, making it much slower.
Most Popular EMA Periods
- 9 EMA: Very fast, used by day traders for short-term momentum
- 12 EMA: Fast signal line used in MACD calculation
- 20 EMA: Popular short-term trend EMA, used extensively in swing trading
- 26 EMA: Slow signal line used in MACD calculation
- 50 EMA: Medium-term trend EMA widely used by swing and position traders
- 200 EMA: Long-term trend EMA — equivalent to SMA 200 in long-term significance
EMA vs SMA
EMA reacts faster to price changes than SMA of the same period. This makes EMA better for trend entry timing and short-to-medium term trading. SMA is better for identifying major long-term support/resistance levels because its smoothness makes it more significant at key price levels. Most professional traders use both — EMA for entries and SMA for trend context.
Strengths of EMA
- More responsive than SMA — captures trend changes earlier
- Still smooth enough to filter most short-term noise
- Industry standard for momentum systems and crossover strategies
- Foundation of MACD and many other popular indicators
Weaknesses of EMA
- More prone to whipsaws than SMA in choppy markets
- Still lags price, just less so than SMA
- More complex calculation than SMA (though this is handled automatically by platforms)
Weighted Moving Average (WMA)
What Is WMA?
The Weighted Moving Average assigns a linearly increasing weight to each price period — the most recent price gets the highest weight, and weights decrease in a straight line going back in time. Unlike EMA which uses exponential weighting, WMA uses simple linear weighting.
WMA Formula
WMA = (P1×n + P2×(n−1) + P3×(n−2) + ... + Pn×1) ÷ (n × (n+1) ÷ 2)
For a 5-period WMA, the most recent closing price is multiplied by 5, the second most recent by 4, the third by 3, the fourth by 2, and the oldest by 1. The total is divided by (5+4+3+2+1) = 15. This gives the most recent price exactly five times the influence of the oldest price.
Strengths of WMA
- More responsive than SMA, slightly faster than EMA for the same period
- Straightforward and transparent weighting logic
- Useful as a building block for more advanced MAs (like HMA)
Weaknesses of WMA
- Less commonly used than SMA or EMA — fewer traders watch it, reducing its self-fulfilling significance
- More erratic than SMA in choppy conditions
Volume Weighted Moving Average (VWMA)
What Is VWMA?
The Volume Weighted Moving Average calculates a moving average where each price is weighted by the trading volume that occurred during that period. Periods with high volume have greater influence on the VWMA than periods with low volume, making it a more meaningful representation of where the market actually transacted most of its business.
VWMA Formula
VWMA = Sum(Close × Volume, n) ÷ Sum(Volume, n)
This formula ensures that high-volume price bars pull the VWMA toward them more strongly than low-volume bars. A large-volume candle represents significant institutional activity — and the VWMA captures this by giving those price levels proportionally more weight.
Why VWMA Matters
A key insight behind VWMA is that price action on high volume is more meaningful than price action on low volume. If a stock spikes higher on very thin volume, that move may not be significant. But if it moves on massive volume, institutions are clearly participating — and the VWMA reflects this by being pulled strongly toward that high-volume price level.
When price is trading above VWMA, buyers have been more active on average — a bullish signal. When price is below VWMA, sellers have been more active — a bearish signal.
VWMA vs VWAP
VWMA (Volume Weighted Moving Average) is different from VWAP (Volume Weighted Average Price). VWAP resets every trading session and is primarily used as an intraday tool. VWMA, by contrast, does not reset and can be applied to any timeframe and lookback period, making it more versatile for multi-day and swing trading analysis.
Strengths of VWMA
- Incorporates volume — a dimension that price-only MAs completely ignore
- Better reflects institutional price levels and areas of real market activity
- Works across all timeframes unlike VWAP
- Excellent for confirming breakouts — if price breaks a level on high volume, VWMA confirms the move
Weaknesses of VWMA
- Not available for assets without volume data (some forex pairs, synthetic indices)
- Can be distorted by unusual volume spikes (earnings reports, news events)
- Less commonly known, so fewer traders watch its levels compared to SMA/EMA
Double Exponential Moving Average (DEMA)
What Is DEMA?
The Double Exponential Moving Average was introduced by Patrick Mulloy in a January 1994 article in Stocks and Commodities Magazine. Mulloy's goal was to reduce the lag inherent in the standard EMA by applying a more sophisticated mathematical construction that effectively doubles the weighting on recent data.
DEMA Formula
DEMA = 2 × EMA(n) − EMA(EMA(n))
DEMA is calculated by taking an EMA of the price, then taking an EMA of that EMA (EMA of EMA), and subtracting the EMA of EMA from twice the first EMA. This double application effectively reduces the lag of the resulting line without significantly increasing noise.
Characteristics of DEMA
- Significantly less lag than a standard EMA of the same period
- Reacts to trend changes earlier than both SMA and EMA
- Still maintains reasonable smoothness despite being faster
- Generates earlier crossover signals — both an advantage and a risk of more false signals
Triple Exponential Moving Average (TEMA)
What Is TEMA?
Also introduced by Patrick Mulloy in the same 1994 article, the Triple Exponential Moving Average takes the lag-reduction concept of DEMA one step further by applying a triple EMA construction.
TEMA Formula
EMA1 = EMA(Price, n)EMA2 = EMA(EMA1, n)EMA3 = EMA(EMA2, n)TEMA = 3 × EMA1 − 3 × EMA2 + EMA3
Characteristics of TEMA
- Even faster than DEMA — minimal lag, reacts almost in real time to price changes
- Excellent for fast-moving, trending markets where speed of signal is critical
- Can be choppy and generate false signals in sideways conditions
- Primarily used by advanced traders and algorithmic systems in high-momentum environments
Hull Moving Average (HMA)
What Is HMA?
The Hull Moving Average was created by Australian mathematician and trader Alan Hull in 2005 with a specific design goal: to virtually eliminate lag while maintaining the smoothness that makes moving averages useful. Most traders who discover the HMA consider it one of the best-kept secrets in technical analysis because it achieves a combination of speed and smoothness that no other common moving average type matches.
HMA Formula
Step 1: Calculate WMA(n/2) of PriceStep 2: Calculate WMA(n) of PriceStep 3: Raw HMA = 2 × WMA(n/2) − WMA(n)Step 4: HMA = WMA(√n) of Raw HMA
The key innovation is Step 3 — doubling the faster WMA and subtracting the slower WMA to create a lead line. This lead line is then re-smoothed with a final WMA using the square root of the period, resulting in a curve that is both smooth and dramatically closer to current price than traditional moving averages.
Why HMA Is Special
Most moving averages face a fundamental trade-off: the smoother they are, the more they lag. The faster they react, the more choppy and noise-filled they become. The HMA largely breaks this trade-off. It is smoother than many traditional MAs while also being faster — making it excellent for identifying the current trend without the delayed signals that plague SMA and EMA.
Strengths of HMA
- Near-zero lag — follows price far more closely than SMA or EMA of the same period
- Smooth line — does not produce the erratic whipsaws that faster indicators often generate
- Excellent for trend direction confirmation — the HMA's slope alone indicates whether momentum is bullish or bearish
- Works on all timeframes and asset classes
Weaknesses of HMA
- Less universally known — fewer traders watch it, so its self-fulfilling significance is lower than the 50 or 200 SMA/EMA
- Can still generate occasional false signals in extreme sideways chop
- More complex formula — requires a platform to calculate it automatically
Moving Average Trading Signals
Signal 1: Price and MA Relationship (Trend Direction)
The simplest and most powerful moving average signal requires only one MA line:
- Bullish: Price is trading consistently above the moving average — the trend is up. Look for buying opportunities on pullbacks to the MA.
- Bearish: Price is trading consistently below the moving average — the trend is down. Look for short-selling opportunities on rallies to the MA.
The moving average itself acts as a dynamic support level in uptrends and a dynamic resistance level in downtrends.
Signal 2: Moving Average Crossover (The Golden Cross and Death Cross)
Using two MAs of different periods — a faster (shorter) one and a slower (longer) one — generates crossover signals:
- Golden Cross (Buy Signal): The fast MA crosses above the slow MA. This signals that short-term momentum has shifted to the upside and a new uptrend may be beginning. The most famous Golden Cross is the 50 SMA crossing above the 200 SMA on the daily chart — widely covered in financial media and closely watched by institutional investors.
- Death Cross (Sell Signal): The fast MA crosses below the slow MA. This signals that short-term momentum has shifted to the downside and a downtrend may be underway. The most famous is the 50 SMA crossing below the 200 SMA.
Common crossover combinations include: 9 EMA / 21 EMA (short-term), 20 EMA / 50 EMA (medium-term), 50 SMA / 200 SMA (long-term).
Signal 3: MA as Dynamic Support and Resistance
Specific moving averages — particularly the 20 EMA, 50 SMA, and 200 SMA — are watched by so many traders and institutions that price consistently bounces off them during trends. In an uptrend, price pulls back to the 20 EMA repeatedly before bouncing higher. In a downtrend, price rallies to the 50 SMA or 200 SMA before falling again. These levels offer high-probability trade entries in the direction of the trend.
Signal 4: MA Slope and Direction
The slope of a moving average tells you the momentum of the trend:
- Steeply rising MA: Strong bullish momentum — trend is healthy and accelerating upward
- Flat MA: Trend is losing momentum — market may be transitioning or consolidating
- Steeply falling MA: Strong bearish momentum — downtrend is healthy and accelerating
Watching the slope change over time is an early warning that a trend is either gaining or losing strength.
Signal 5: MA Ribbon (Multiple MAs)
Plotting several moving averages of consecutive periods simultaneously creates a Moving Average Ribbon. When the ribbon is fanned out and ordered (fast MA on top, slow MA on bottom during uptrends), it confirms a strong trend. When the ribbon begins to converge, it signals weakening momentum. When MAs begin crossing each other and the ribbon twists, a trend reversal or consolidation is likely underway.
| Signal Type | Bullish Condition | Bearish Condition | Reliability |
|---|---|---|---|
| Price vs MA | Price consistently above MA | Price consistently below MA | High in trending markets |
| MA Crossover (Golden/Death Cross) | Fast MA crosses above slow MA | Fast MA crosses below slow MA | Moderate — confirm with volume |
| Dynamic Support/Resistance | Price bounces off MA from above | Price rejects MA from below | High at major MAs (50, 200) |
| MA Slope | MA sloping upward steeply | MA sloping downward steeply | Good momentum gauge |
| MA Ribbon | Ribbon fanned out, fast on top | Ribbon fanned out, fast on bottom | High in strong trends |
How to Add Moving Averages on TradingView — Step by Step
TradingView makes adding and customizing every type of moving average fast and intuitive. Follow these detailed steps to set up any MA on your chart.
Step 1: Open TradingView and Load a Chart
- Open your browser and navigate to www.tradingview.com.
- Log in to your account or create a free one if you have not already done so.
- Click "Chart" in the top navigation to open the full charting interface.
- In the symbol search box at the top left, type the asset you want to analyze — for example, NIFTY 50, SENSEX, RELIANCE, BTCUSDT, EURUSD, or any stock, index, or crypto pair.
- Select your desired timeframe from the toolbar at the top of the chart (e.g., D for Daily, W for Weekly, 1H for 1-hour, 15 for 15-minute).

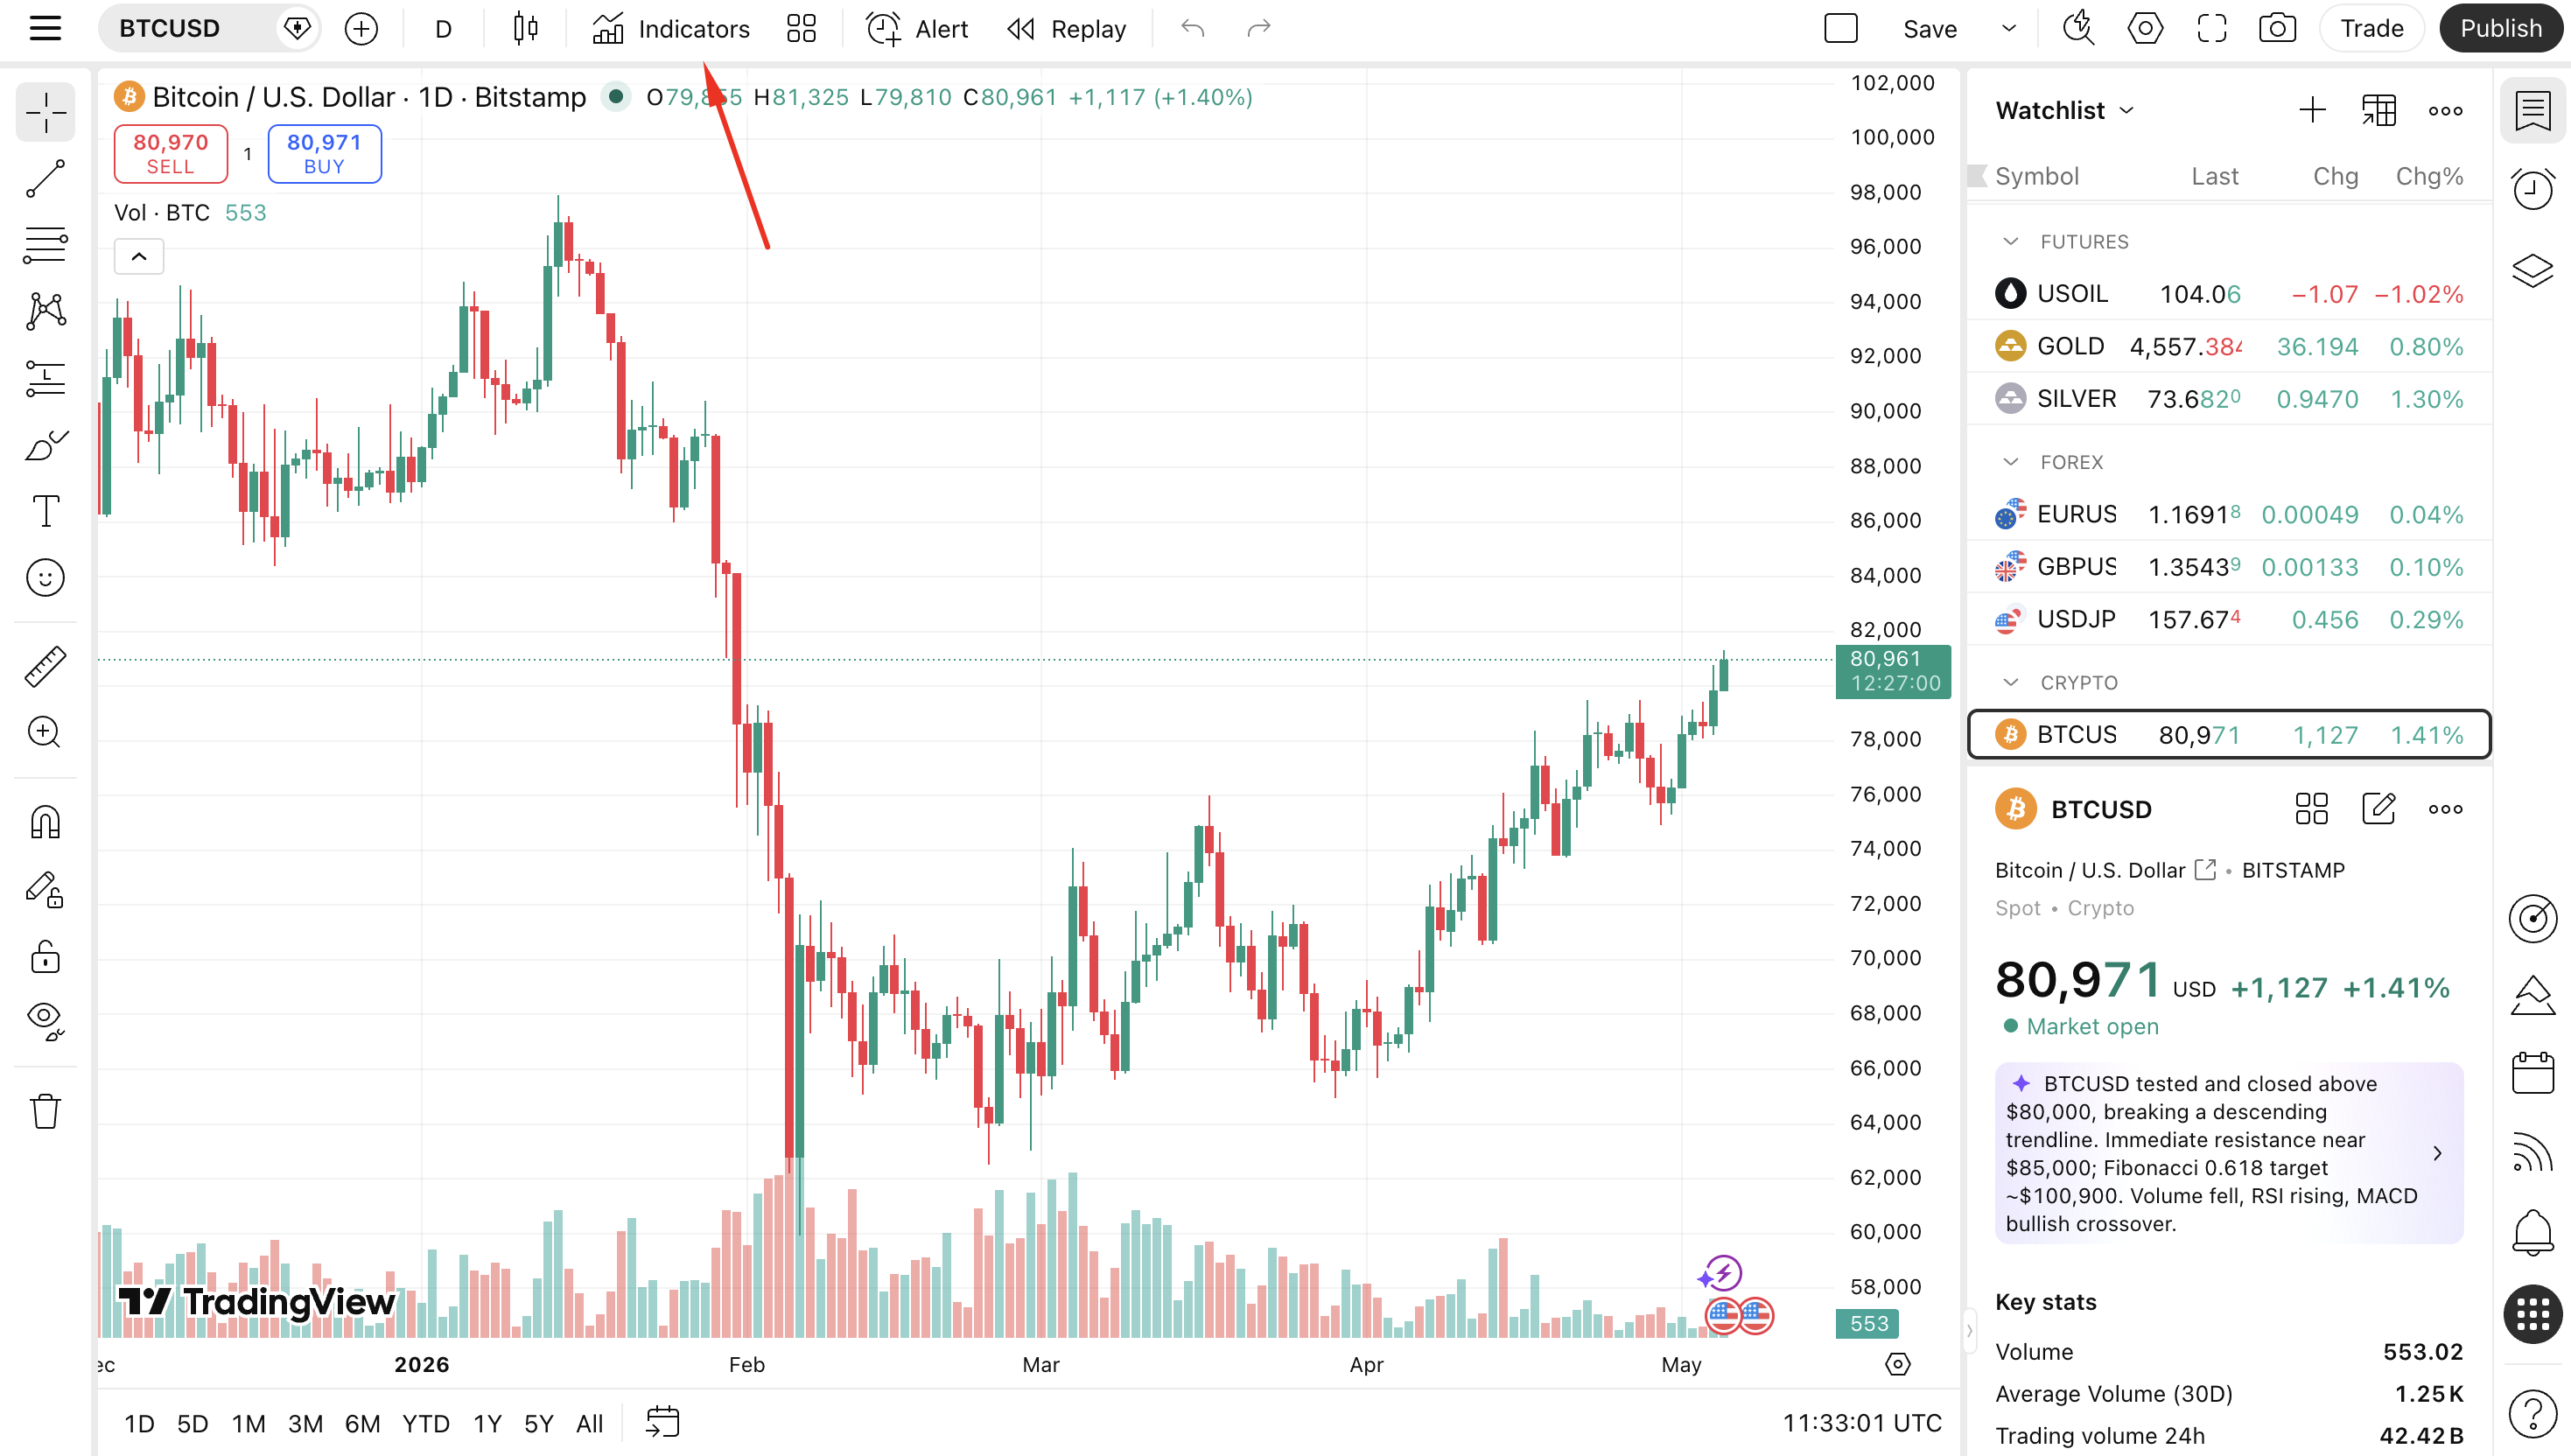
Step 2: Open the Indicators Panel
- Look at the top toolbar above your chart.
- Click the "Indicators" button — it is labeled with a small chart icon or the text Indicators / f(x), located in the center-top of the toolbar.
- The Indicator Search dialog will open immediately.
- Keyboard shortcut: Press "/" on your keyboard to open the indicator search dialog instantly.
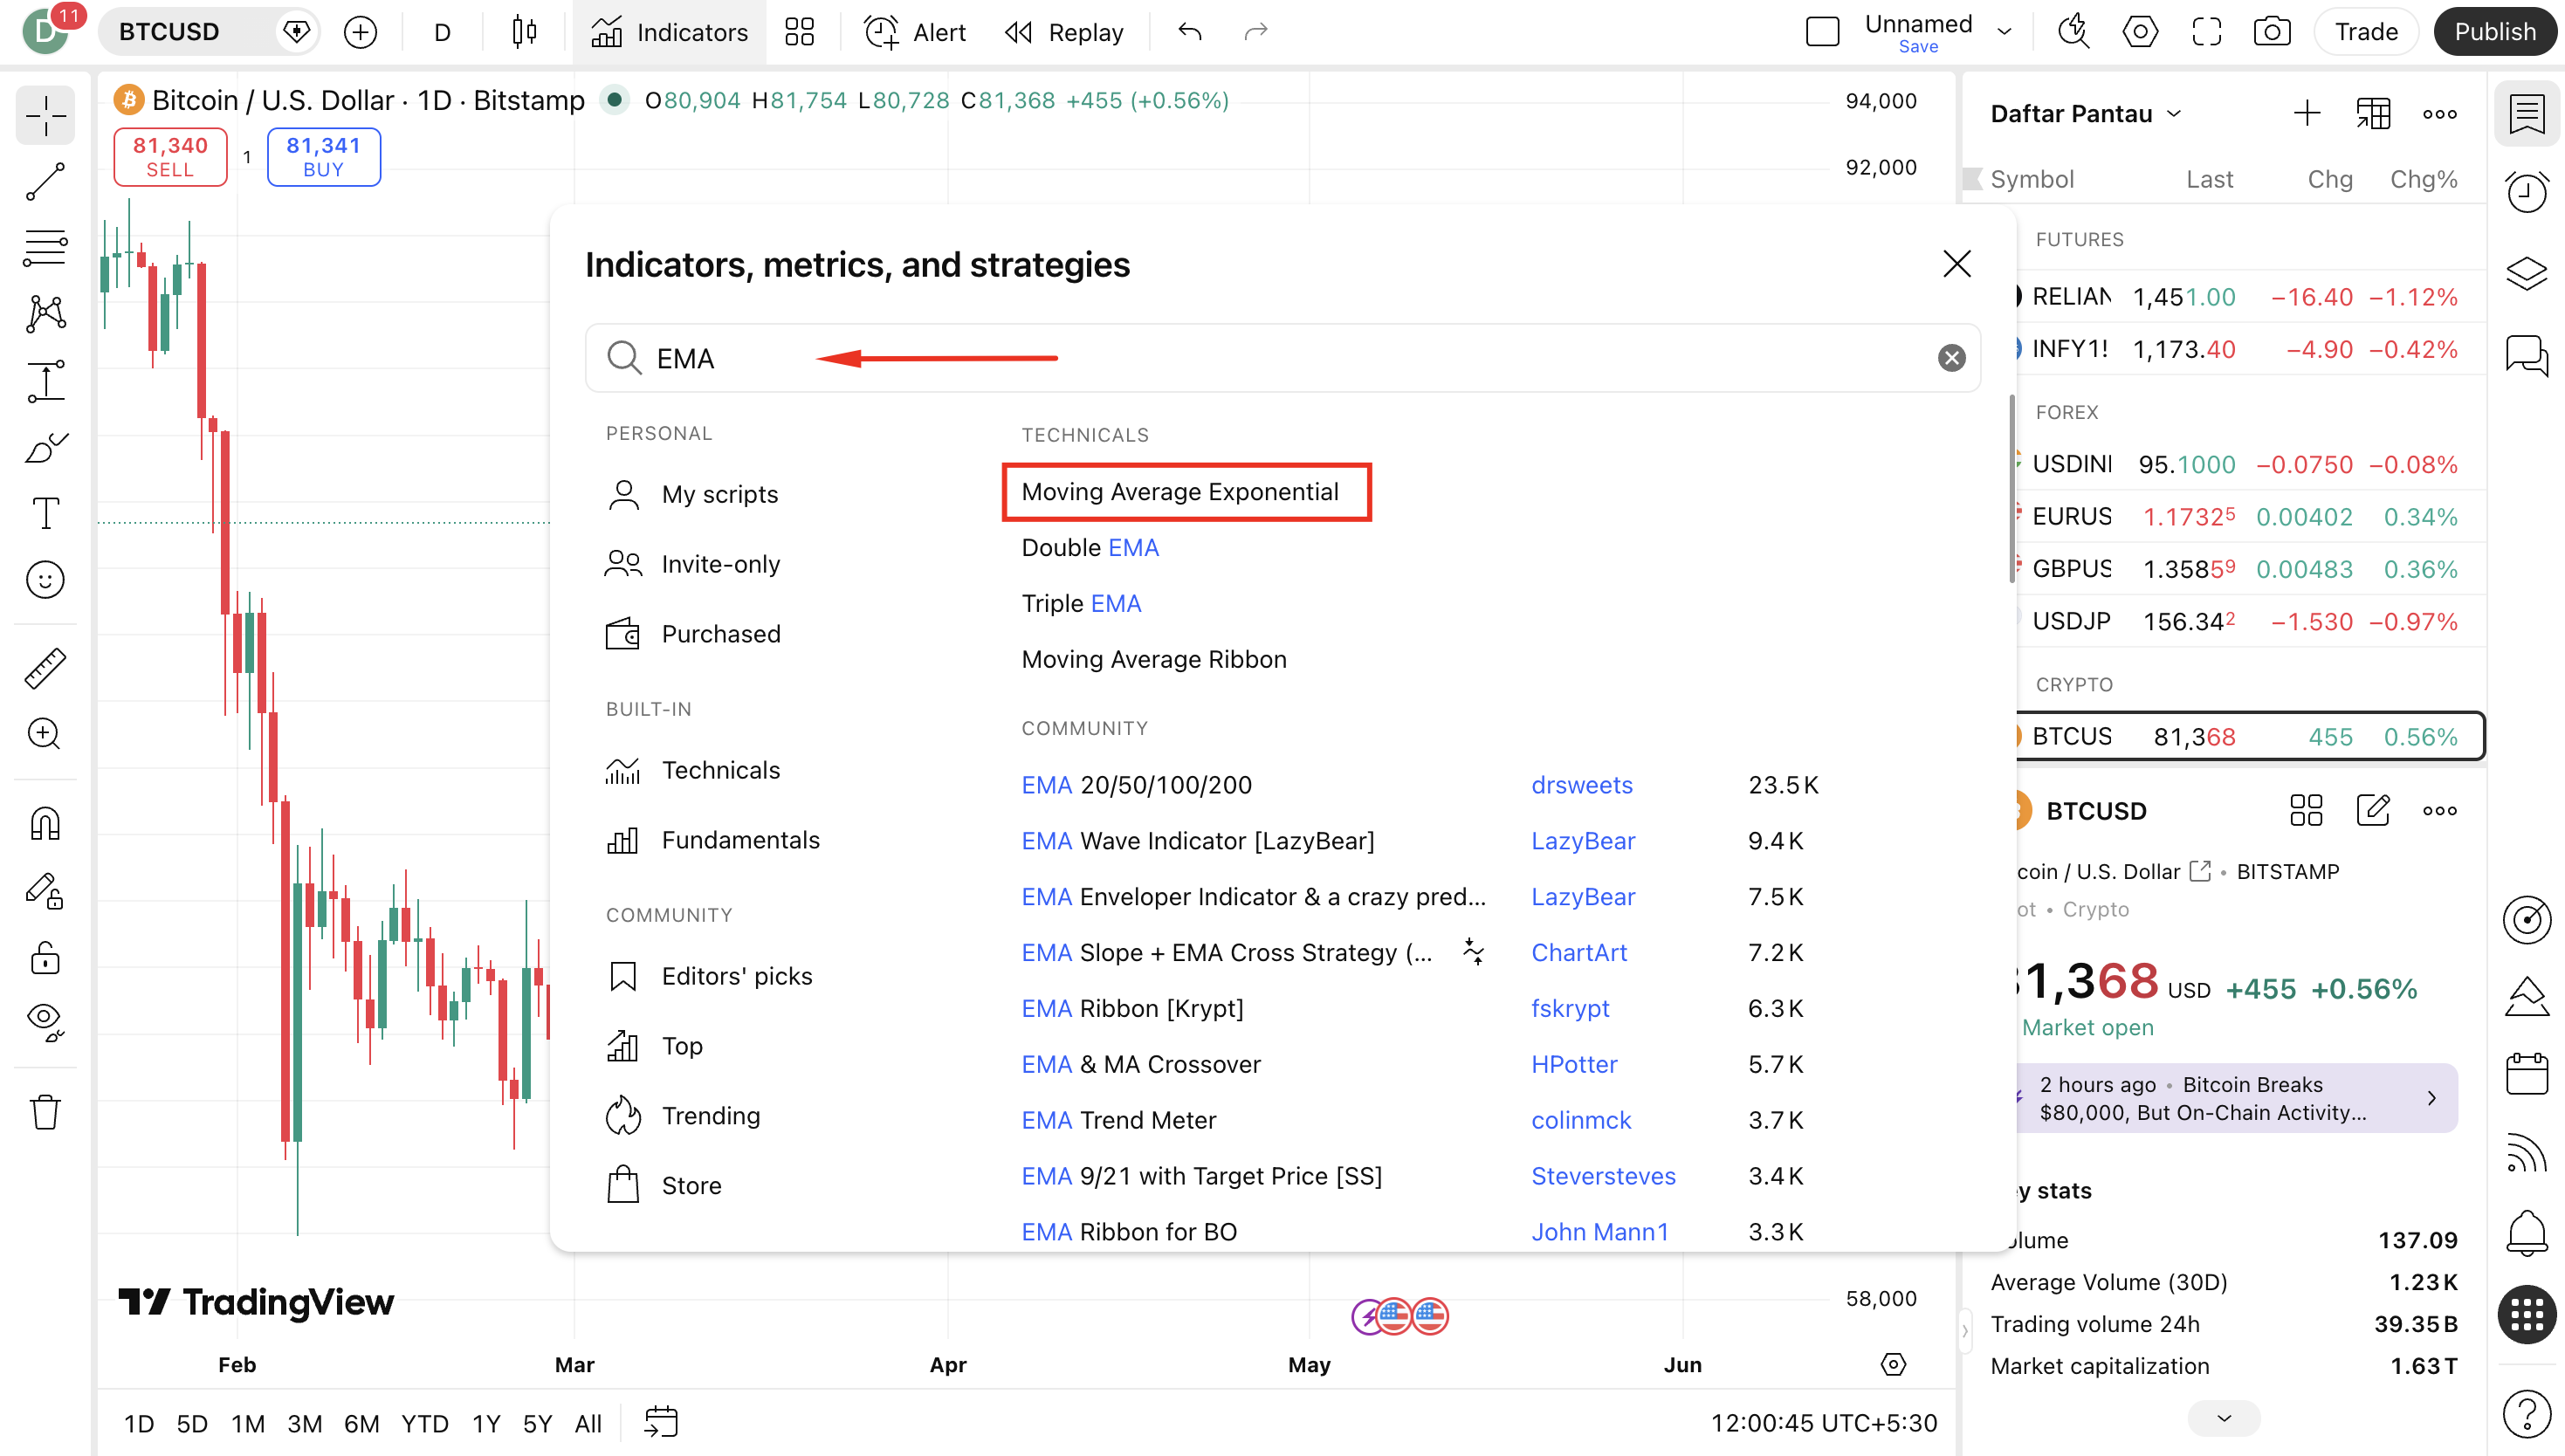
Step 3: Search for Your Moving Average Type
- In the search field at the top of the Indicator dialog, type the name of the moving average you want:
| What to Type | What You Will Find |
|---|---|
| "Moving Average" | Basic SMA (Simple Moving Average) |
| "EMA" | Exponential Moving Average |
| "WMA" | Weighted Moving Average |
| "VWMA" | Volume Weighted Moving Average |
| "DEMA" | Double Exponential Moving Average |
| "TEMA" | Triple Exponential Moving Average |
| "HMA" | Hull Moving Average |
| "MA" | Shows all Moving Average types at once |
- Choose the result listed under "Built-ins" for reliability. Community scripts can also be excellent for advanced versions with extra features.
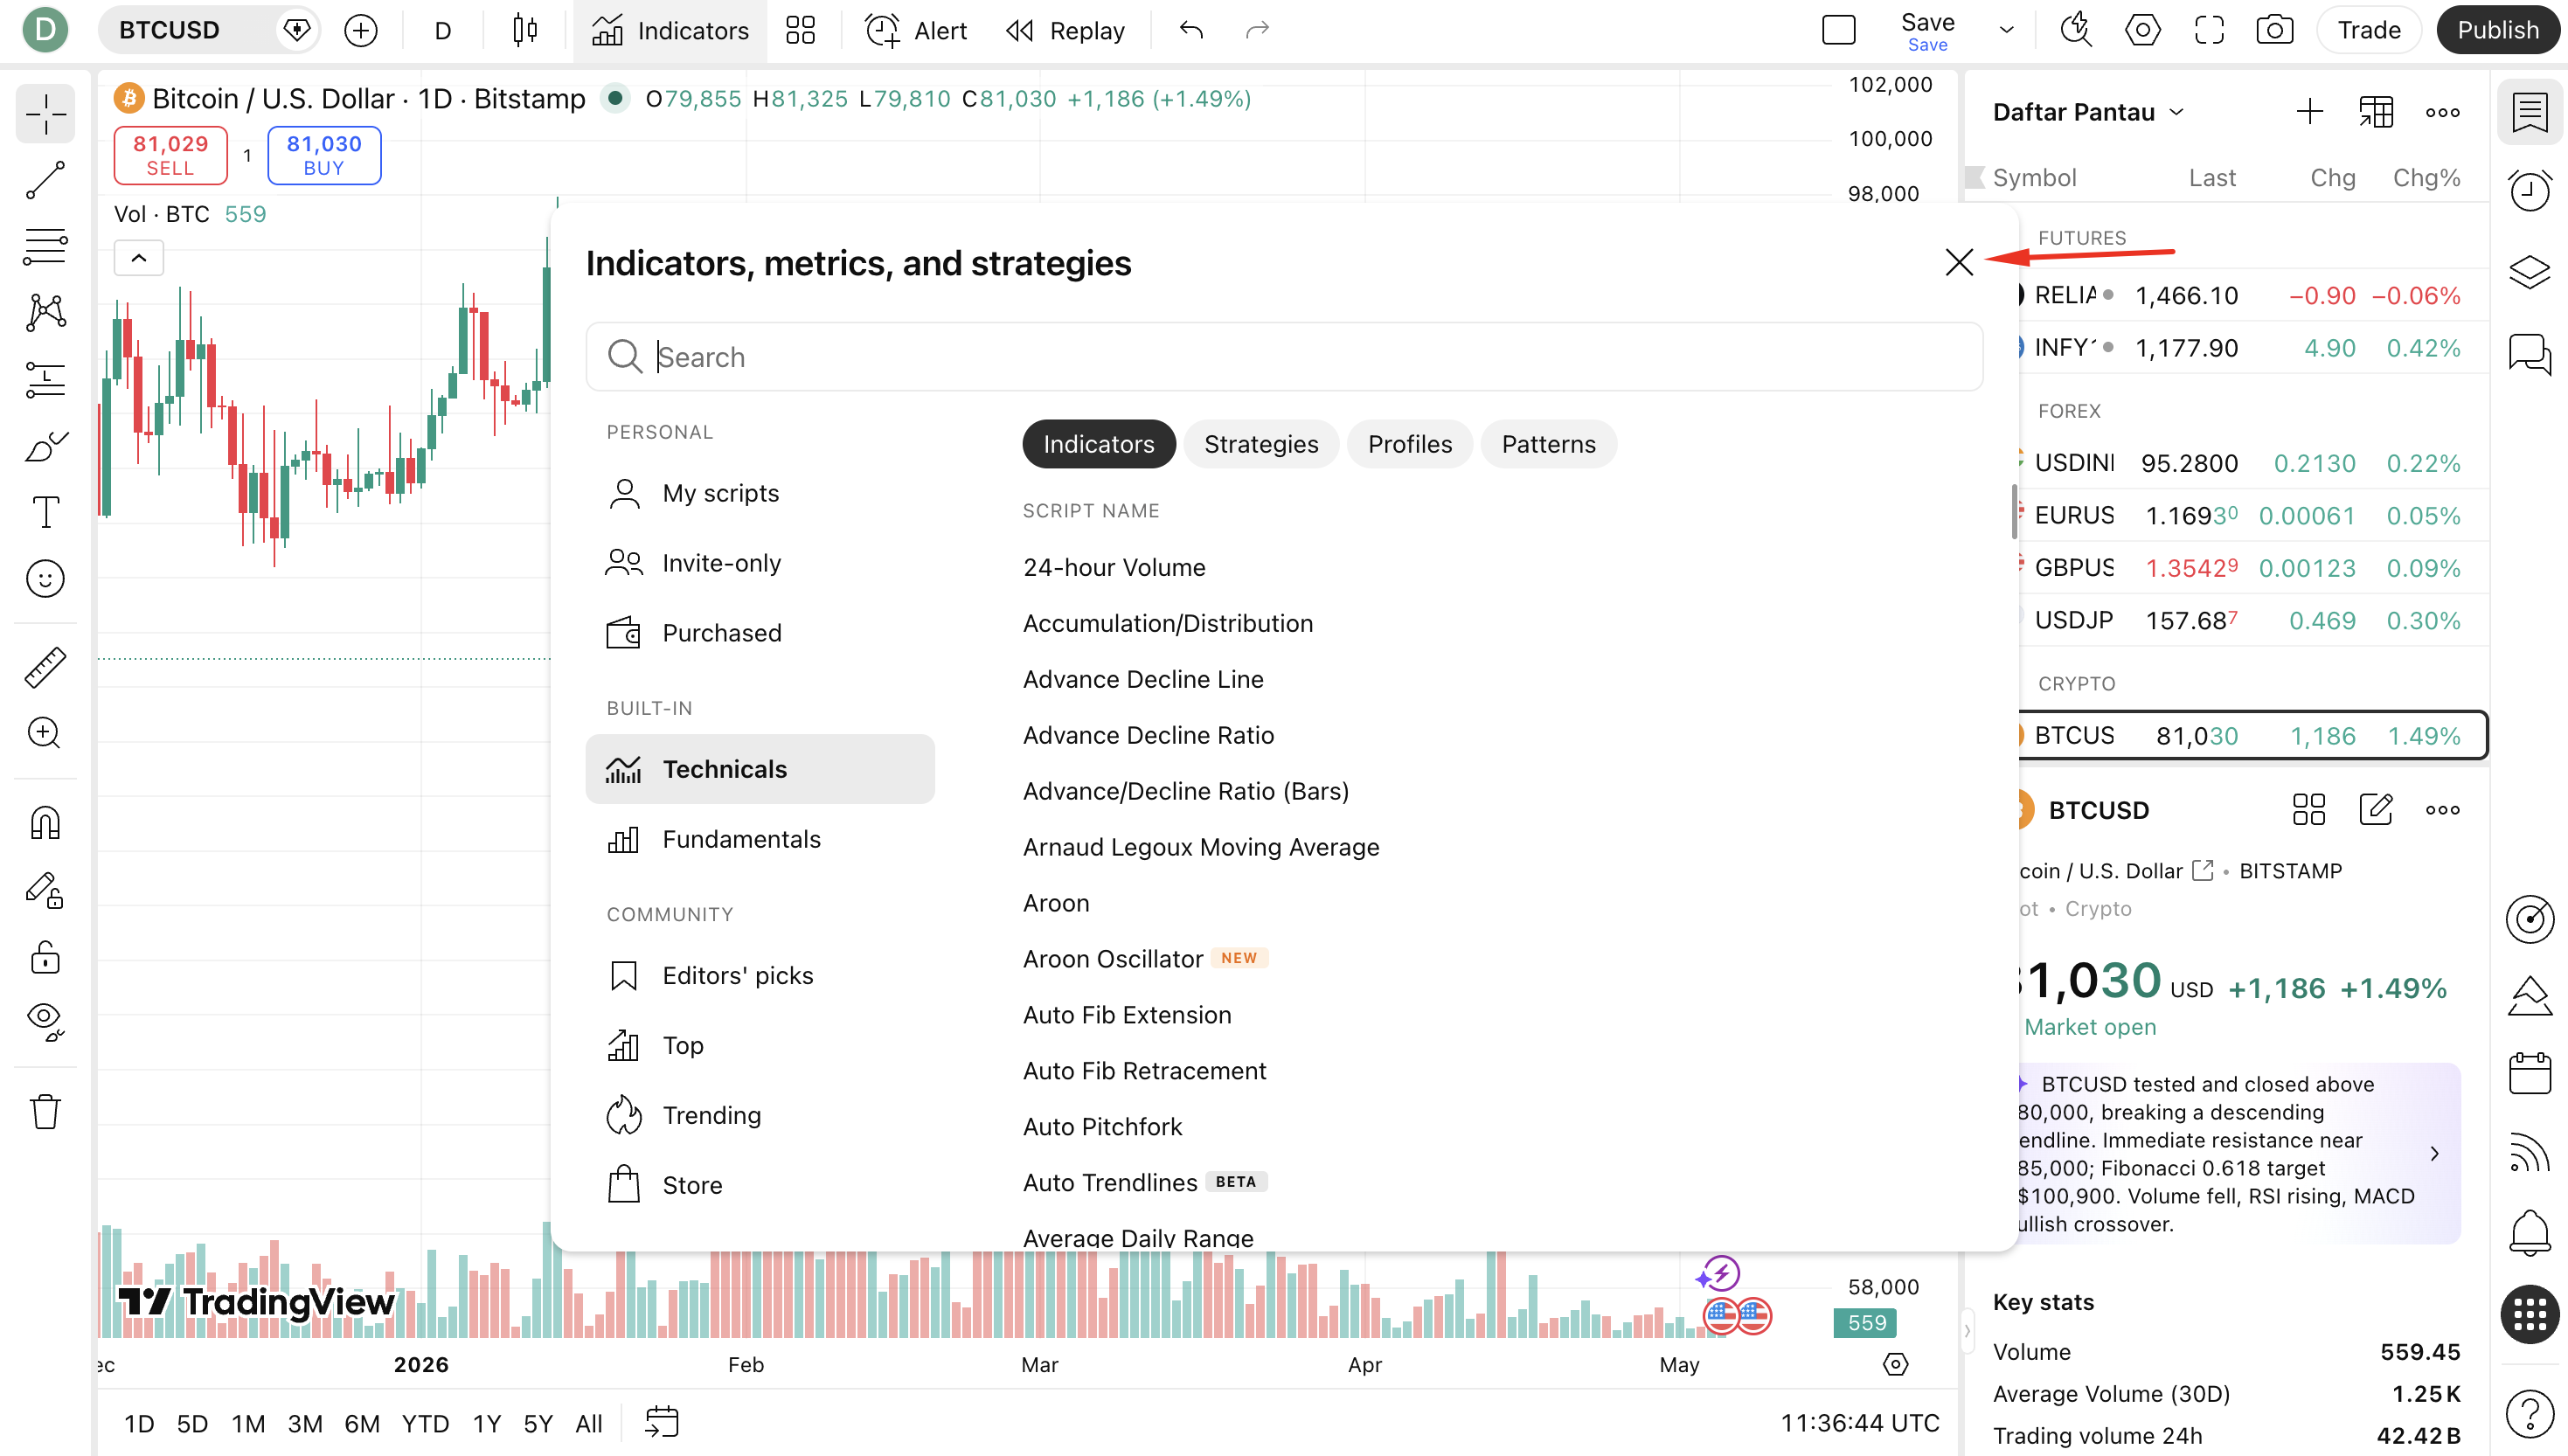
Step 4: Add the Moving Average to Your Chart
- Click the moving average you want from the search results.
- Unlike RSI and MACD which open in a separate panel below, most moving averages are plotted directly on the price chart — overlaid on top of the candlesticks. This is their natural home since they represent price levels.
- The MA line will appear on your chart immediately.
- You can add multiple moving averages simultaneously — simply repeat the search and add process for each one. For example, add a 20 EMA, a 50 EMA, and a 200 SMA all at the same time for a complete multi-MA setup.
- Close the indicator dialog by clicking the X or clicking outside it.
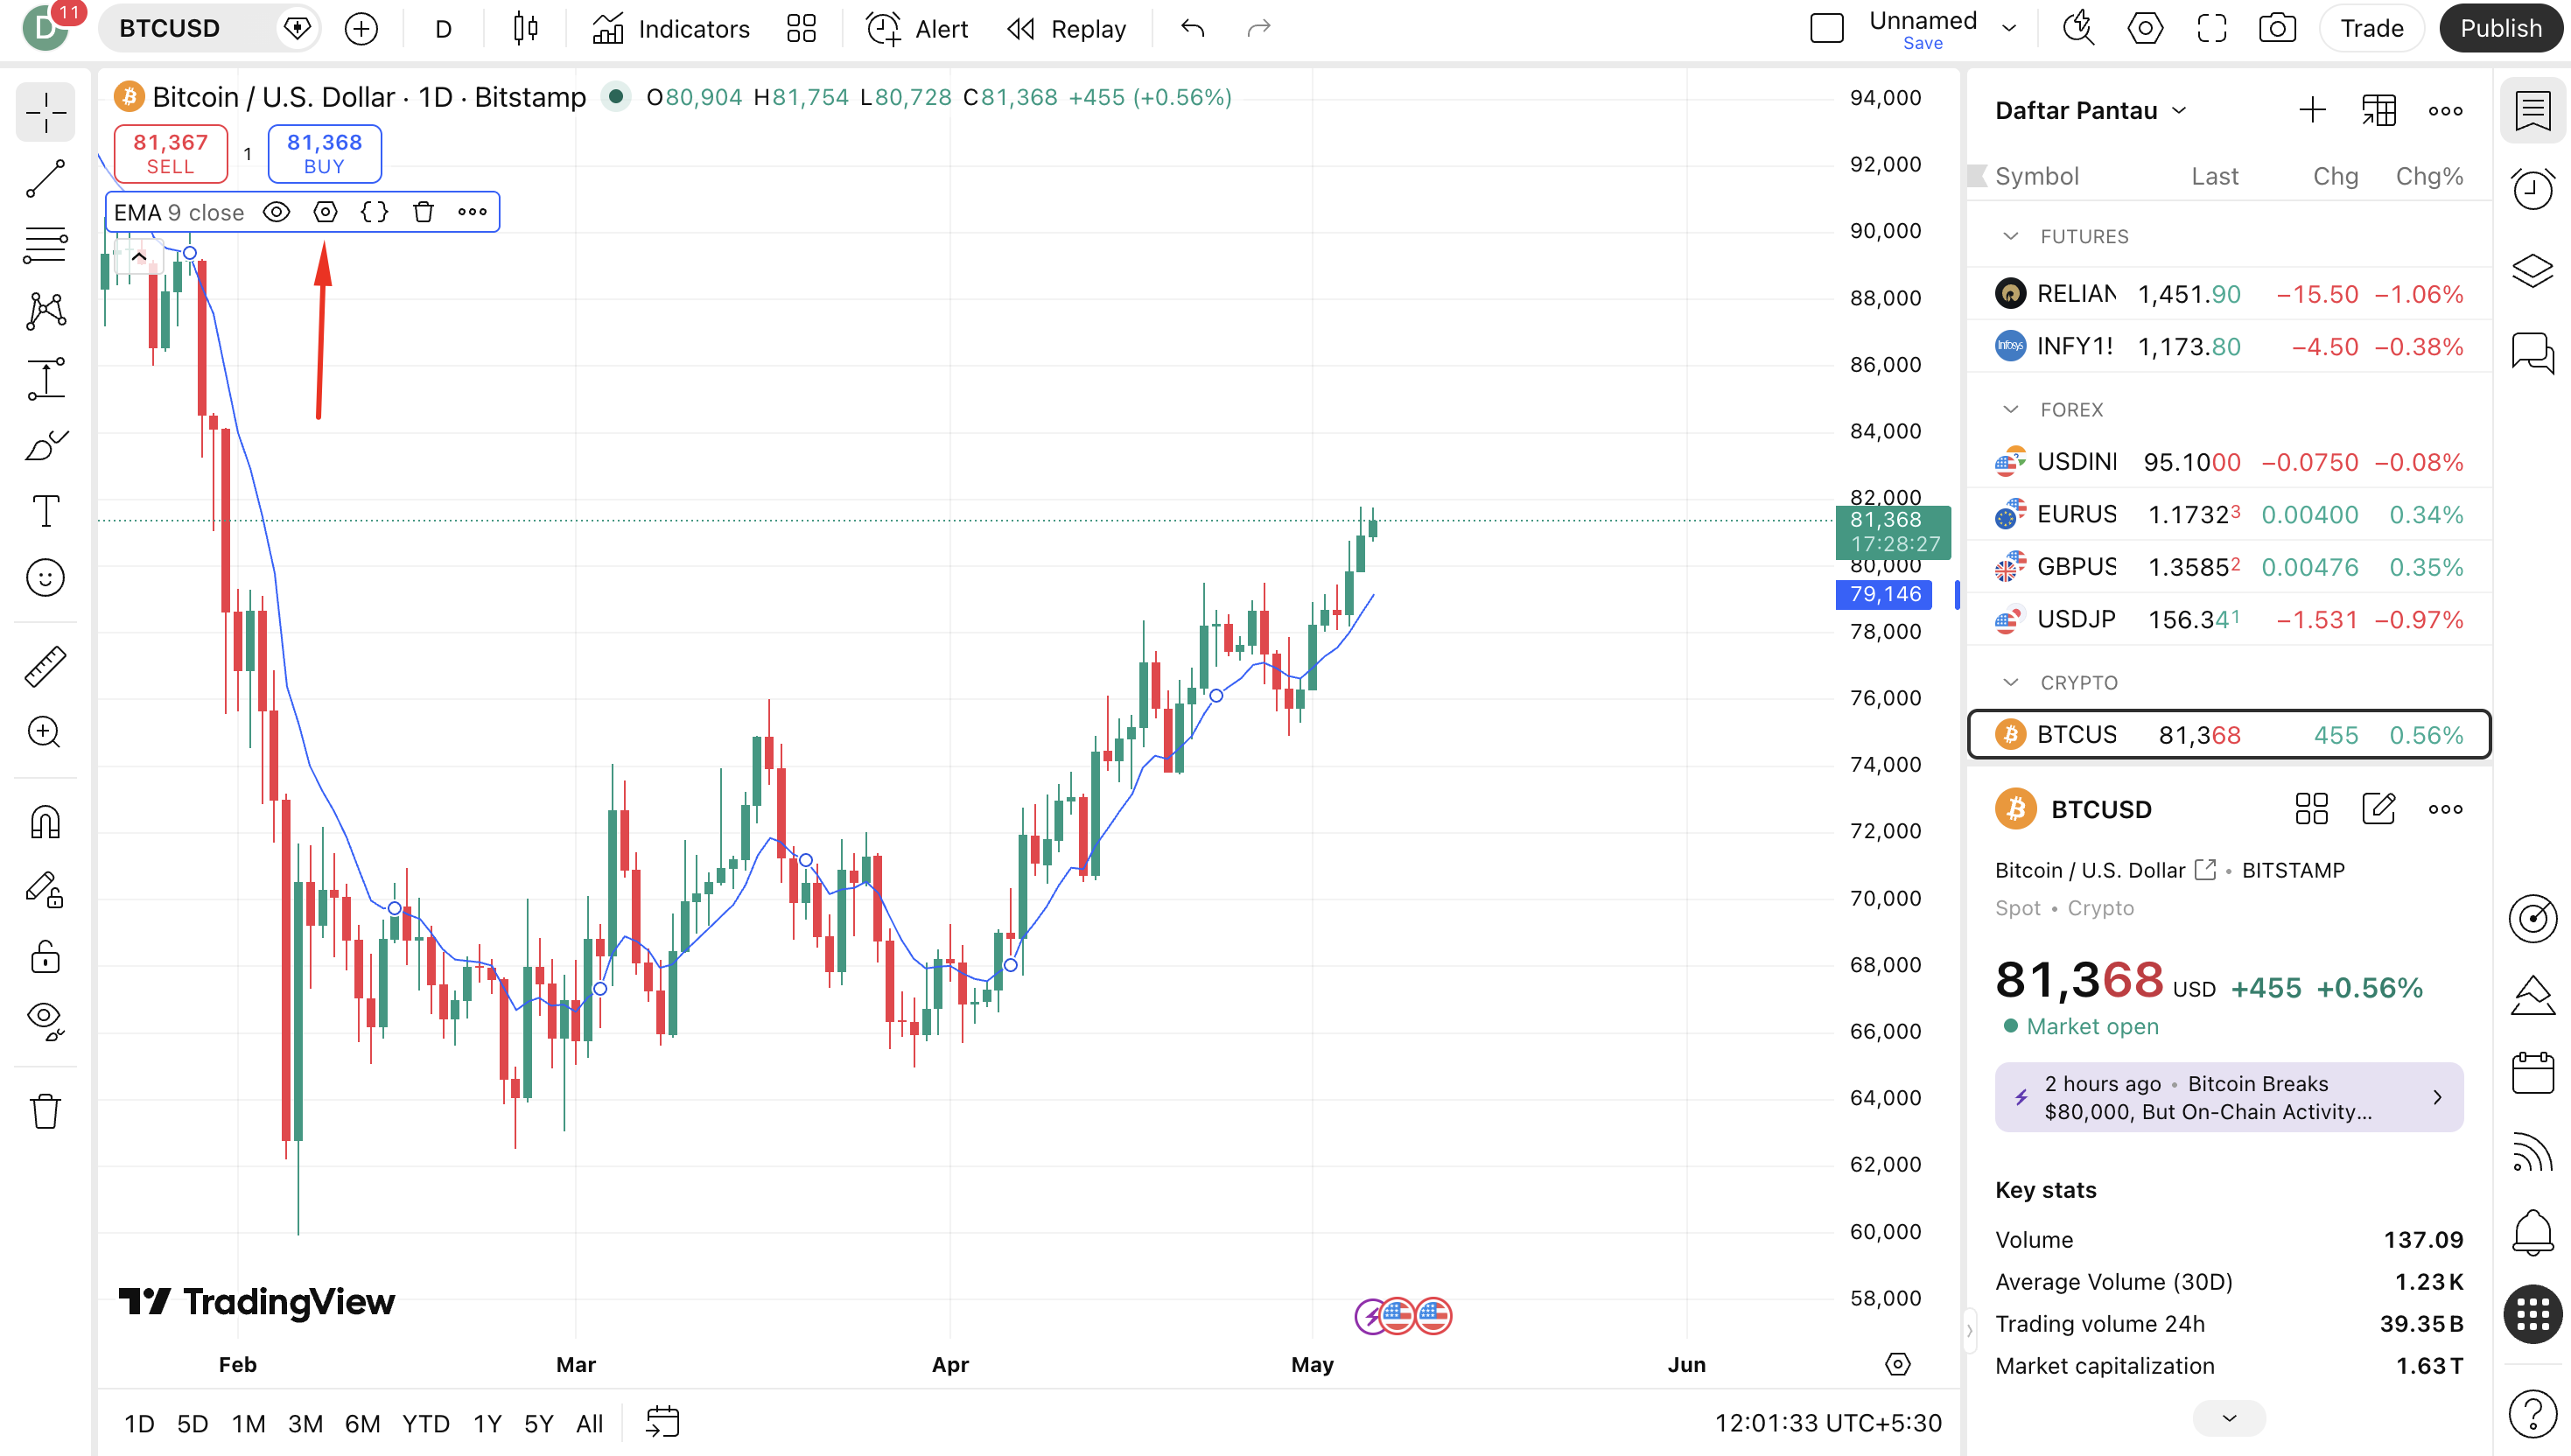
Step 5: Open Moving Average Settings
- After adding the MA, look at the top-left corner of the chart panel (not a separate panel — directly on the chart). You will see the MA label such as "MA (20)" or "EMA (20)".
- Hover over this label. A gear icon (⚙) will appear next to it.
- Click the gear icon to open the settings dialog.
- Alternatively, double-click directly on the MA line on the chart to open settings instantly.
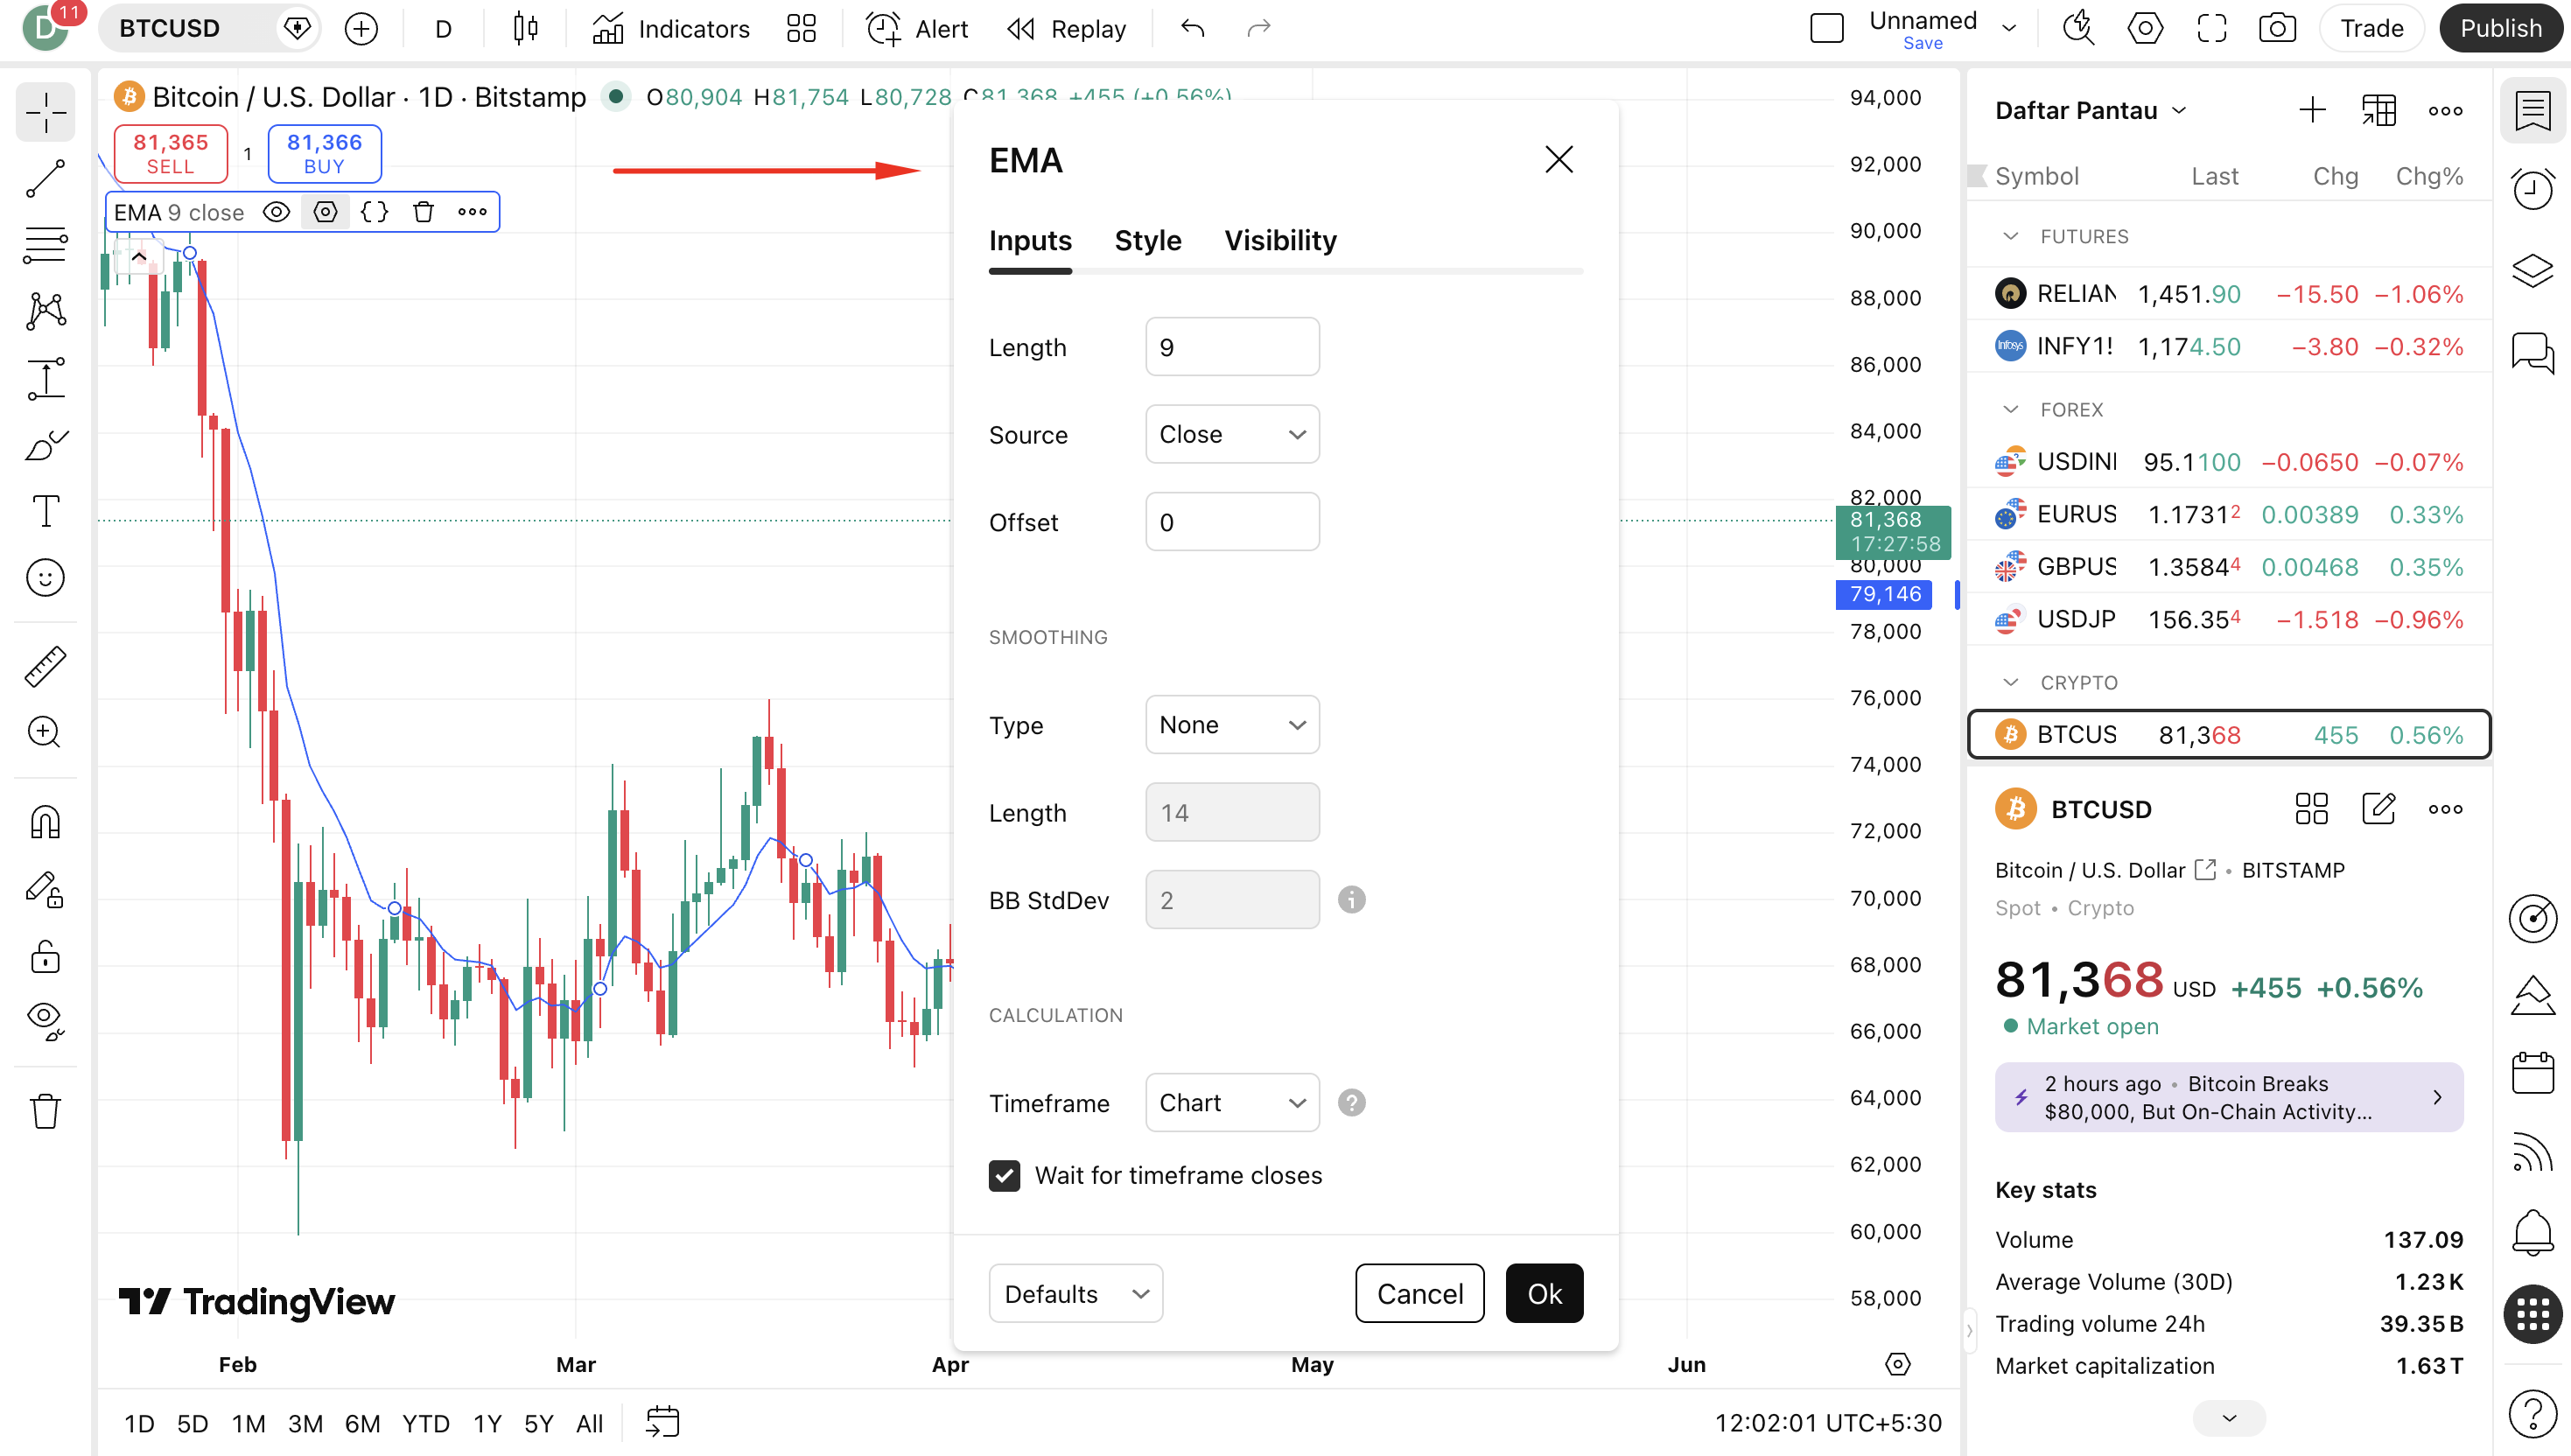
Step 6: Configure Moving Average Settings
The settings dialog has three tabs: Inputs, Style, and Visibility.
Inputs Tab — Core Settings:
- Length / Period: The number of price bars included in the calculation. This is the most important setting. Common values: 9, 20, 50, 100, 200 for SMA/EMA; 10, 20 for HMA.
- Source: Which price to use for the calculation. Default is Close. Options include Open, High, Low, HL2 (High+Low÷2), HLC3 (High+Low+Close÷3), OHLC4 (all four averaged).
- Offset: Shifts the MA line forward or backward on the chart. Default is 0. Useful for specific displacement strategies.
Style Tab — Visual Customization:
- Change the color of the MA line — use distinct colors for each MA when plotting multiple (e.g., blue for 20 EMA, orange for 50 EMA, red for 200 SMA)
- Adjust the line thickness — thicker lines are more visible; use thicker lines for major MAs like 200 SMA
- Change the line style — solid, dashed, or dotted — useful for visually distinguishing MAs when multiple are plotted
Visibility Tab:
- Control which timeframes show the MA (e.g., only show the 200 SMA on Daily and above)
Step 7: Set Up a Multi-MA System (Recommended)
Professional traders rarely use just one moving average. A robust multi-MA setup gives you both short-term and long-term trend context simultaneously. Here is the most popular professional multi-MA configuration:
- Add 20 EMA — color: Blue — Line thickness: 1 (short-term trend and dynamic support)
- Add 50 EMA — color: Orange — Line thickness: 2 (medium-term trend — widely watched by funds)
- Add 200 SMA — color: Red — Line thickness: 2 (long-term trend — the most important MA in stock analysis)
- Optionally add 9 EMA — color: Light Blue — Line thickness: 1 (very short-term momentum for precise entries)
This setup gives you four layers of trend information on a single chart — from the fastest short-term momentum to the slowest long-term trend.
Step 8: Save Your Chart Layout
- After setting up all your moving averages with your preferred colors and periods, save your layout.
- Press Ctrl + S (Windows) or Cmd + S (Mac) to save, or click the save icon at the top-right of TradingView.
- Name your layout clearly (e.g., "Multi-MA Setup" or "EMA Trend System") so you can reload it instantly on any future session.
- To make a specific MA your default setting that loads automatically on new charts, open its settings, configure it, then click "Set as Default" before clicking OK.
Quick Reference: TradingView Moving Average Setup Checklist
| Step | Action | Notes |
|---|---|---|
| 1 | Open TradingView and load a chart | Select your symbol and timeframe |
| 2 | Click "Indicators" in the top toolbar | Or press "/" shortcut |
| 3 | Search for your MA type (EMA, SMA, HMA etc.) | Choose Built-in version for reliability |
| 4 | Click MA to add it to chart | Plots directly on price chart (not separate panel) |
| 5 | Click gear icon or double-click MA line | Opens settings dialog |
| 6 | Set Period and Source in Inputs tab | Customize color and thickness in Style tab |
| 7 | Repeat for each MA (20 EMA, 50 EMA, 200 SMA) | Use distinct colors for each MA |
| 8 | Save layout with Ctrl+S / Cmd+S | Name it clearly for easy recall |
Moving Average Settings for Different Trading Styles
Scalping (1m–5m Charts)
Scalpers need the fastest possible MA response. Use the 9 EMA and 21 EMA as the primary crossover system. The HMA (10) can also be useful for near-zero-lag trend direction on ultra-short timeframes. Avoid SMA on scalping timeframes — it is far too slow.
Day Trading (15m–1H Charts)
Day traders commonly use the 9 EMA, 20 EMA, and 50 EMA combination. The 9/20 EMA crossover provides short-term entry signals, while the 50 EMA acts as a trend filter — only take long trades when price is above the 50 EMA and short trades below it.
Swing Trading (4H–Daily Charts)
Swing traders benefit from the classic 20 EMA + 50 EMA + 200 SMA combination. The 20 EMA provides dynamic support/resistance for entry timing. The 50 EMA defines the medium-term trend. The 200 SMA defines the long-term trend and is the most important reference level.
Position Trading and Investing (Weekly–Monthly Charts)
Long-term traders focus on the 50 SMA and 200 SMA. The Golden Cross (50 SMA above 200 SMA) is a major long-term bullish signal. The Death Cross (50 SMA below 200 SMA) is a major long-term bearish signal. Weekly timeframe analysis using these MAs is how many fund managers assess secular market trends.
| Trading Style | Recommended MAs | Best Timeframe | Key Signal |
|---|---|---|---|
| Scalping | 9 EMA, 21 EMA, HMA(10) | 1m, 3m, 5m | 9/21 EMA crossover |
| Day Trading | 9 EMA, 20 EMA, 50 EMA | 15m, 30m, 1H | Price above/below 50 EMA |
| Swing Trading | 20 EMA, 50 EMA, 200 SMA | 4H, Daily | Pullback to 20 EMA in trend |
| Position Trading | 50 SMA, 200 SMA | Daily, Weekly | Golden Cross / Death Cross |
| Long-Term Investing | 200 SMA or 200 EMA | Weekly, Monthly | Price above/below 200 |
Pro Tips for Using Moving Averages Effectively
Tip 1: The 200 SMA Is the Most Important Line on Any Chart
No single indicator level is watched more closely by institutional traders, fund managers, and algorithmic systems than the 200-day Simple Moving Average. Price trading above the 200 SMA is the most basic definition of a long-term bull trend. Price below it defines a bear trend. Always know where the 200 SMA is on your daily chart before making any trading decision.
Tip 2: Trade Pullbacks to Moving Averages — Not Crossovers Alone
Moving average crossovers are often late signals — by the time the fast MA crosses the slow MA, a significant portion of the initial move may already be over. A better approach in trending markets is to wait for price to pull back to a key MA (like the 20 EMA or 50 EMA) and then look for a bounce entry in the direction of the trend. This approach gives better risk-reward ratios than chasing crossovers.
Tip 3: Use MA Confluence Zones
When multiple MAs cluster together at approximately the same price level, that cluster is a high-significance support or resistance zone. For example, if the 50 EMA, 100 SMA, and a prior resistance level all coincide near the same price, that area is an extremely strong support zone if price trades back into it from above.
Tip 4: Always Assess Whether the Market Is Trending or Ranging
Moving averages perform extremely well in trending markets and very poorly in sideways, ranging markets. Before applying MA strategies, assess the market condition. If the MA is flat and price is repeatedly crossing above and below it, you are in a range — avoid MA crossover signals in this environment. Consider using RSI or Stochastic instead until a trend establishes itself.
Tip 5: Match Your MA Type to Your Trading Goal
Use SMA for long-term trend context and major support/resistance levels. Use EMA for trend following, crossover systems, and timely entries. Use HMA when you want the fastest possible trend reading with minimal lag. Use VWMA when volume context matters and you want to understand where institutions are positioned. Mix types intelligently — for example, a 200 SMA for long-term context combined with a 20 EMA for short-term entries.
Tip 6: Do Not Use Too Many Moving Averages at Once
It is tempting to add many MA lines to your chart, but too many create visual clutter and analysis paralysis. Three MAs maximum on any chart is a good rule. A clean, well-chosen trio — such as 20 EMA, 50 EMA, and 200 SMA — provides all the trend information you need without overwhelming the chart.
Limitations of Moving Averages
1. Inherently Lagging
All moving averages — even the fastest HMA or TEMA — are based on historical price data. This means they always lag current price to some degree. In fast-moving markets or during sharp reversals, MA signals come too late to catch the beginning of the move, and traders who rely solely on MA crossovers often enter after the best price has already passed.
2. Poor Performance in Sideways Markets
Moving averages were designed for trending markets. In choppy, range-bound conditions, price crosses back and forth through moving averages repeatedly, generating a stream of false signals and whipsaw trades. Using MAs without first confirming the presence of a trend is one of the most common and costly beginner mistakes.
3. Self-Fulfilling at Major Levels
While the self-fulfilling nature of major MAs (50 SMA, 200 SMA) makes them powerful support/resistance tools, it also means they can create artificial price reactions that do not reflect fundamental value. Price bouncing off the 200 SMA may be driven purely by mass trader psychology rather than genuine supply and demand — and those bounces can fail when the crowd eventually changes its mind.
4. No Fixed Overbought or Oversold Levels
Unlike RSI or Stochastic, moving averages do not have built-in overbought/oversold thresholds. A price that is 30% above its 200 SMA may be extremely extended on one stock but perfectly normal for another. Traders must develop market-specific intuition about how extended a price can get before reverting — there is no universal rule.
Conclusion
Moving averages are not just one indicator — they are the foundational language of trend analysis, spoken by traders, algorithms, and institutions across every financial market on earth. From the simple elegance of the SMA to the mathematical sophistication of the HMA, each type of moving average offers a slightly different lens through which to view market momentum and trend direction.
Understanding the differences between SMA, EMA, WMA, VWMA, DEMA, TEMA, and HMA — and knowing when to use each one — elevates your technical analysis from basic chart reading to genuinely informed market assessment. The ability to look at a chart with a well-configured multi-MA setup and instantly understand the trend direction across multiple timeframes is a foundational skill that every serious trader must develop.
The 200-day SMA will continue to be the most-watched trend indicator in stock markets for decades to come. The 20 EMA will continue to act as a dynamic support level in bull trends. The HMA will continue to provide the fastest trend readings with minimal noise. And moving average crossovers will continue to generate the clearest, most objective trend-change signals available to any trader at any experience level.
Start by adding the 20 EMA, 50 EMA, and 200 SMA to your daily charts on TradingView. Study how price behaves around each line. Watch for bounces, rejections, crossovers, and slope changes. With consistent observation, these three lines alone will transform how you read market structure and make trading decisions.
Frequently Asked Questions
Why do moving averages fail in sideways markets?▼
Moving averages were designed for trending markets. In sideways, range-bound conditions, price crosses back and forth through moving average lines repeatedly — generating a stream of false buy and sell signals that lead to small losses (whipsaws) that accumulate over time. Always assess whether the market is in a trend or a range before applying MA strategies. In ranging conditions, oscillators like RSI or Stochastic work better than trend-following MAs.
What is a Golden Cross and Death Cross?▼
A Golden Cross occurs when a shorter-period moving average (typically the 50 SMA) crosses above a longer-period moving average (typically the 200 SMA) — signaling a long-term bullish trend change. A Death Cross is the opposite — the 50 SMA crosses below the 200 SMA — signaling a long-term bearish trend change. Both are closely watched by institutional traders and often covered extensively in financial media.
Which moving average is best for trading?▼
There is no single 'best' moving average — the right choice depends on your trading style. For swing trading on daily charts, the 20 EMA and 50 EMA are excellent for entries while the 200 SMA defines the long-term trend. For day trading, the 9 EMA and 20 EMA are popular. For long-term investing, the 200 SMA is the most important. The Hull Moving Average (HMA) is best when you want minimal lag with maximum smoothness.
Related Blogs

RSI Indicator: The Complete Guide — History, How It Works & TradingView Setup
A professional, in-depth guide to the RSI (Relative Strength Index) indicator — covering its history, how it works, overbought and oversold signals, divergence, and a step-by-step walkthrough to add and configure RSI on TradingView.

MACD Indicator: The Complete Guide — History, How It Works & TradingView Setup
A professional, in-depth guide to the MACD indicator — covering its history, how it works, signals it generates, and a step-by-step walkthrough to add and configure MACD on TradingView with screenshots.