MACD Indicator: The Complete Guide — History, How It Works & TradingView Setup
A professional, in-depth guide to the MACD indicator — covering its history, how it works, signals it generates, and a step-by-step walkthrough to add and configure MACD on TradingView with screenshots.

What Is MACD?
The Moving Average Convergence Divergence (MACD) is a trend-following momentum indicator that shows the relationship between two exponential moving averages (EMAs) of a security's price. It is plotted as two lines and a histogram, helping traders identify the direction, strength, and duration of a trend — and potential reversals.
MACD is widely used across all financial markets — stocks, forex, commodities, cryptocurrency, and indices — making it one of the most versatile tools in a trader's toolkit.
"MACD is the Swiss Army knife of technical indicators — it reveals momentum, trend direction, and potential reversals all in a single view."
History of MACD
The Creator: Gerald Appel
MACD was developed by Gerald Appel, a financial analyst, author, and money manager based in New York. Appel introduced the MACD indicator in the late 1970s — specifically around 1979 — in his book and newsletter focused on technical analysis and stock market timing.
Appel's goal was to create a simple yet effective tool that could capture momentum shifts in price, allowing traders to identify optimal entry and exit points without drowning in complex calculations.
The Signal Line Addition
In the early 1980s, Thomas Aspray made a significant enhancement to the original MACD by adding the signal line (a 9-period EMA of the MACD line) and the histogram. The histogram visually represents the difference between the MACD line and the signal line, making it much easier to spot crossovers and momentum shifts at a glance.
Aspray's addition transformed MACD from a useful indicator into a comprehensive momentum analysis tool, and this version became the standard used worldwide today.
Rise to Popularity
Throughout the 1980s and 1990s, as personal computers and charting software became accessible to retail traders, MACD became one of the most commonly included default indicators on every major trading platform. Its inclusion in books like "Technical Analysis of the Financial Markets" by John J. Murphy cemented its status as a foundational trading tool.
Today, MACD is pre-installed on virtually every trading platform worldwide — from MetaTrader to TradingView — and remains one of the top indicators used by both beginner and professional traders.
| Year | Milestone |
|---|---|
| 1979 | Gerald Appel creates MACD using two EMAs |
| Early 1980s | Thomas Aspray adds the Signal Line and Histogram |
| 1986 | MACD published in "Technical Analysis of Stock Trends" |
| 1990s | Mainstream adoption with rise of charting software |
| 2000s–Present | Universal inclusion on all trading platforms globally |
Why Is MACD Useful?
MACD has stood the test of time for several important reasons. Here is why traders across all skill levels rely on it:
1. Combines Trend and Momentum
Most indicators do one thing — they either identify a trend OR measure momentum. MACD does both simultaneously. It tells you which direction the market is moving and how strongly it is moving in that direction.
2. Easy to Read Visually
The histogram bars grow and shrink in real time, giving traders an immediate visual sense of whether momentum is increasing or decreasing — without needing to crunch numbers manually.
3. Versatile Across Markets and Timeframes
MACD works on any timeframe — from 1-minute scalping charts to monthly investment charts — and across all asset classes including equities, forex pairs, crypto, futures, and ETFs.
4. Identifies Divergence
One of MACD's most powerful uses is spotting divergence — when price makes a new high or low but MACD does not confirm it. This is often an early warning signal of a trend reversal before it happens on the price chart.
5. Free and Built-In
Unlike premium indicators that require subscriptions, MACD is free and built into every charting platform. No coding or custom setup is required.
6. Pairs Well With Other Indicators
MACD complements other indicators exceptionally well — particularly RSI, Bollinger Bands, volume indicators, and support/resistance levels — allowing traders to build multi-confirmation trading systems.
How MACD Works
MACD is built on Exponential Moving Averages (EMAs). Unlike Simple Moving Averages (SMA), EMAs give more weight to recent price data, making them more responsive to current market conditions.
The Core Formula
The MACD calculation involves three steps:
- Calculate the Fast EMA (12-period EMA):
This EMA reacts quickly to recent price changes and represents short-term momentum.
Fast EMA = EMA(Close, 12) - Calculate the Slow EMA (26-period EMA):
This EMA is slower and represents the longer-term trend direction.
Slow EMA = EMA(Close, 26) - Calculate the MACD Line:
The MACD Line is simply the difference between the two EMAs.
MACD Line = Fast EMA (12) − Slow EMA (26) - Calculate the Signal Line:
The Signal Line is a 9-period EMA of the MACD Line itself.
Signal Line = EMA(MACD Line, 9) - Calculate the Histogram:
The Histogram shows the distance between the MACD Line and the Signal Line.
Histogram = MACD Line − Signal Line
Default Parameters: (12, 26, 9)
The default settings of MACD are 12, 26, and 9. These were chosen by Gerald Appel based on empirical testing on daily stock charts and represent two trading weeks (12 days), one trading month (26 days), and one and a half trading weeks (9 days) respectively.
What Does "Convergence" and "Divergence" Mean?
Convergence happens when the two EMAs move toward each other — meaning momentum is weakening. Divergence happens when they move apart — meaning momentum is strengthening. The MACD line oscillates above and below zero as this relationship shifts.
MACD Components Explained
1. The MACD Line (Blue Line)
This is the primary line. When the MACD Line is above zero, the 12-period EMA is above the 26-period EMA — indicating bullish momentum. When it is below zero, bearish momentum dominates.
2. The Signal Line (Orange/Red Line)
This is the 9-period EMA of the MACD Line. It acts like a trigger — when the MACD Line crosses above the Signal Line, it is a potential buy signal. When it crosses below, it is a potential sell signal.
3. The Histogram (Bars)
The histogram visually represents the gap between the MACD Line and the Signal Line:
- Positive bars (above zero): MACD Line is above Signal Line → bullish momentum
- Negative bars (below zero): MACD Line is below Signal Line → bearish momentum
- Growing bars: Momentum is increasing in the current direction
- Shrinking bars: Momentum is weakening — possible reversal approaching
4. The Zero Line
When the MACD Line crosses the zero line from below, it signals a bullish trend change (12 EMA crossing above 26 EMA). Crossing from above to below signals a bearish trend change.
MACD Trading Signals
Signal 1: MACD Crossover (Most Common Signal)
The most widely used MACD signal is the crossover between the MACD Line and the Signal Line.
- Bullish Crossover (Buy Signal): The MACD Line crosses above the Signal Line. This suggests upward momentum is building.
- Bearish Crossover (Sell Signal): The MACD Line crosses below the Signal Line. This suggests downward momentum is increasing.
Best Practice: Crossovers that occur far from the zero line tend to be stronger and more reliable than those near zero.
Signal 2: Zero Line Crossover
When the MACD Line crosses the zero line:
- Cross above zero: The short-term EMA has crossed above the long-term EMA — a confirmation of a bullish trend.
- Cross below zero: A confirmation of a bearish trend shift.
Zero-line crossovers are slower signals but tend to be more reliable for confirming medium-to-long-term trend changes.
Signal 3: MACD Divergence (Most Powerful Signal)
Divergence occurs when price and MACD move in opposite directions. This is considered one of the strongest reversal signals in technical analysis.
- Bullish Divergence: Price makes a lower low, but MACD makes a higher low. This indicates that selling momentum is weakening even as price falls — a reversal to the upside may be imminent.
- Bearish Divergence: Price makes a higher high, but MACD makes a lower high. This indicates buying momentum is fading even as price rises — a reversal to the downside may follow.
Important: Divergence signals are not precise timing tools. Always wait for price confirmation (such as a candlestick reversal pattern or support/resistance break) before entering a trade based on divergence.
Signal 4: Histogram Momentum Shift
Watch the histogram bars carefully:
- When positive bars start getting shorter — bullish momentum is fading
- When negative bars start getting shorter — bearish momentum is fading
These early histogram signals often precede the actual MACD/Signal line crossover, giving traders earlier entry opportunities.
| Signal Type | Bullish | Bearish | Reliability |
|---|---|---|---|
| MACD/Signal Crossover | MACD crosses above Signal | MACD crosses below Signal | Moderate |
| Zero Line Crossover | MACD crosses above 0 | MACD crosses below 0 | Moderate–High |
| Divergence | Price lower low / MACD higher low | Price higher high / MACD lower high | High (with confirmation) |
| Histogram Shrinkage | Negative bars shrinking | Positive bars shrinking | Early warning |
How to Add MACD on TradingView — Step by Step
TradingView is the world's leading charting platform, used by millions of traders. Adding MACD is quick and straightforward. Follow these steps carefully:
Step 1: Open TradingView and Load a Chart
- Go to www.tradingview.com in your browser.
- Sign in to your account (or create a free account if you don't have one).
- Click on "Chart" in the top navigation bar to open the charting interface.
- In the symbol search box (top-left of the chart), type the asset you want to analyze — for example, NIFTY, RELIANCE, BTCUSDT, or any stock/forex pair.
- Select your desired timeframe from the toolbar (1D for daily, 1H for hourly, etc.)

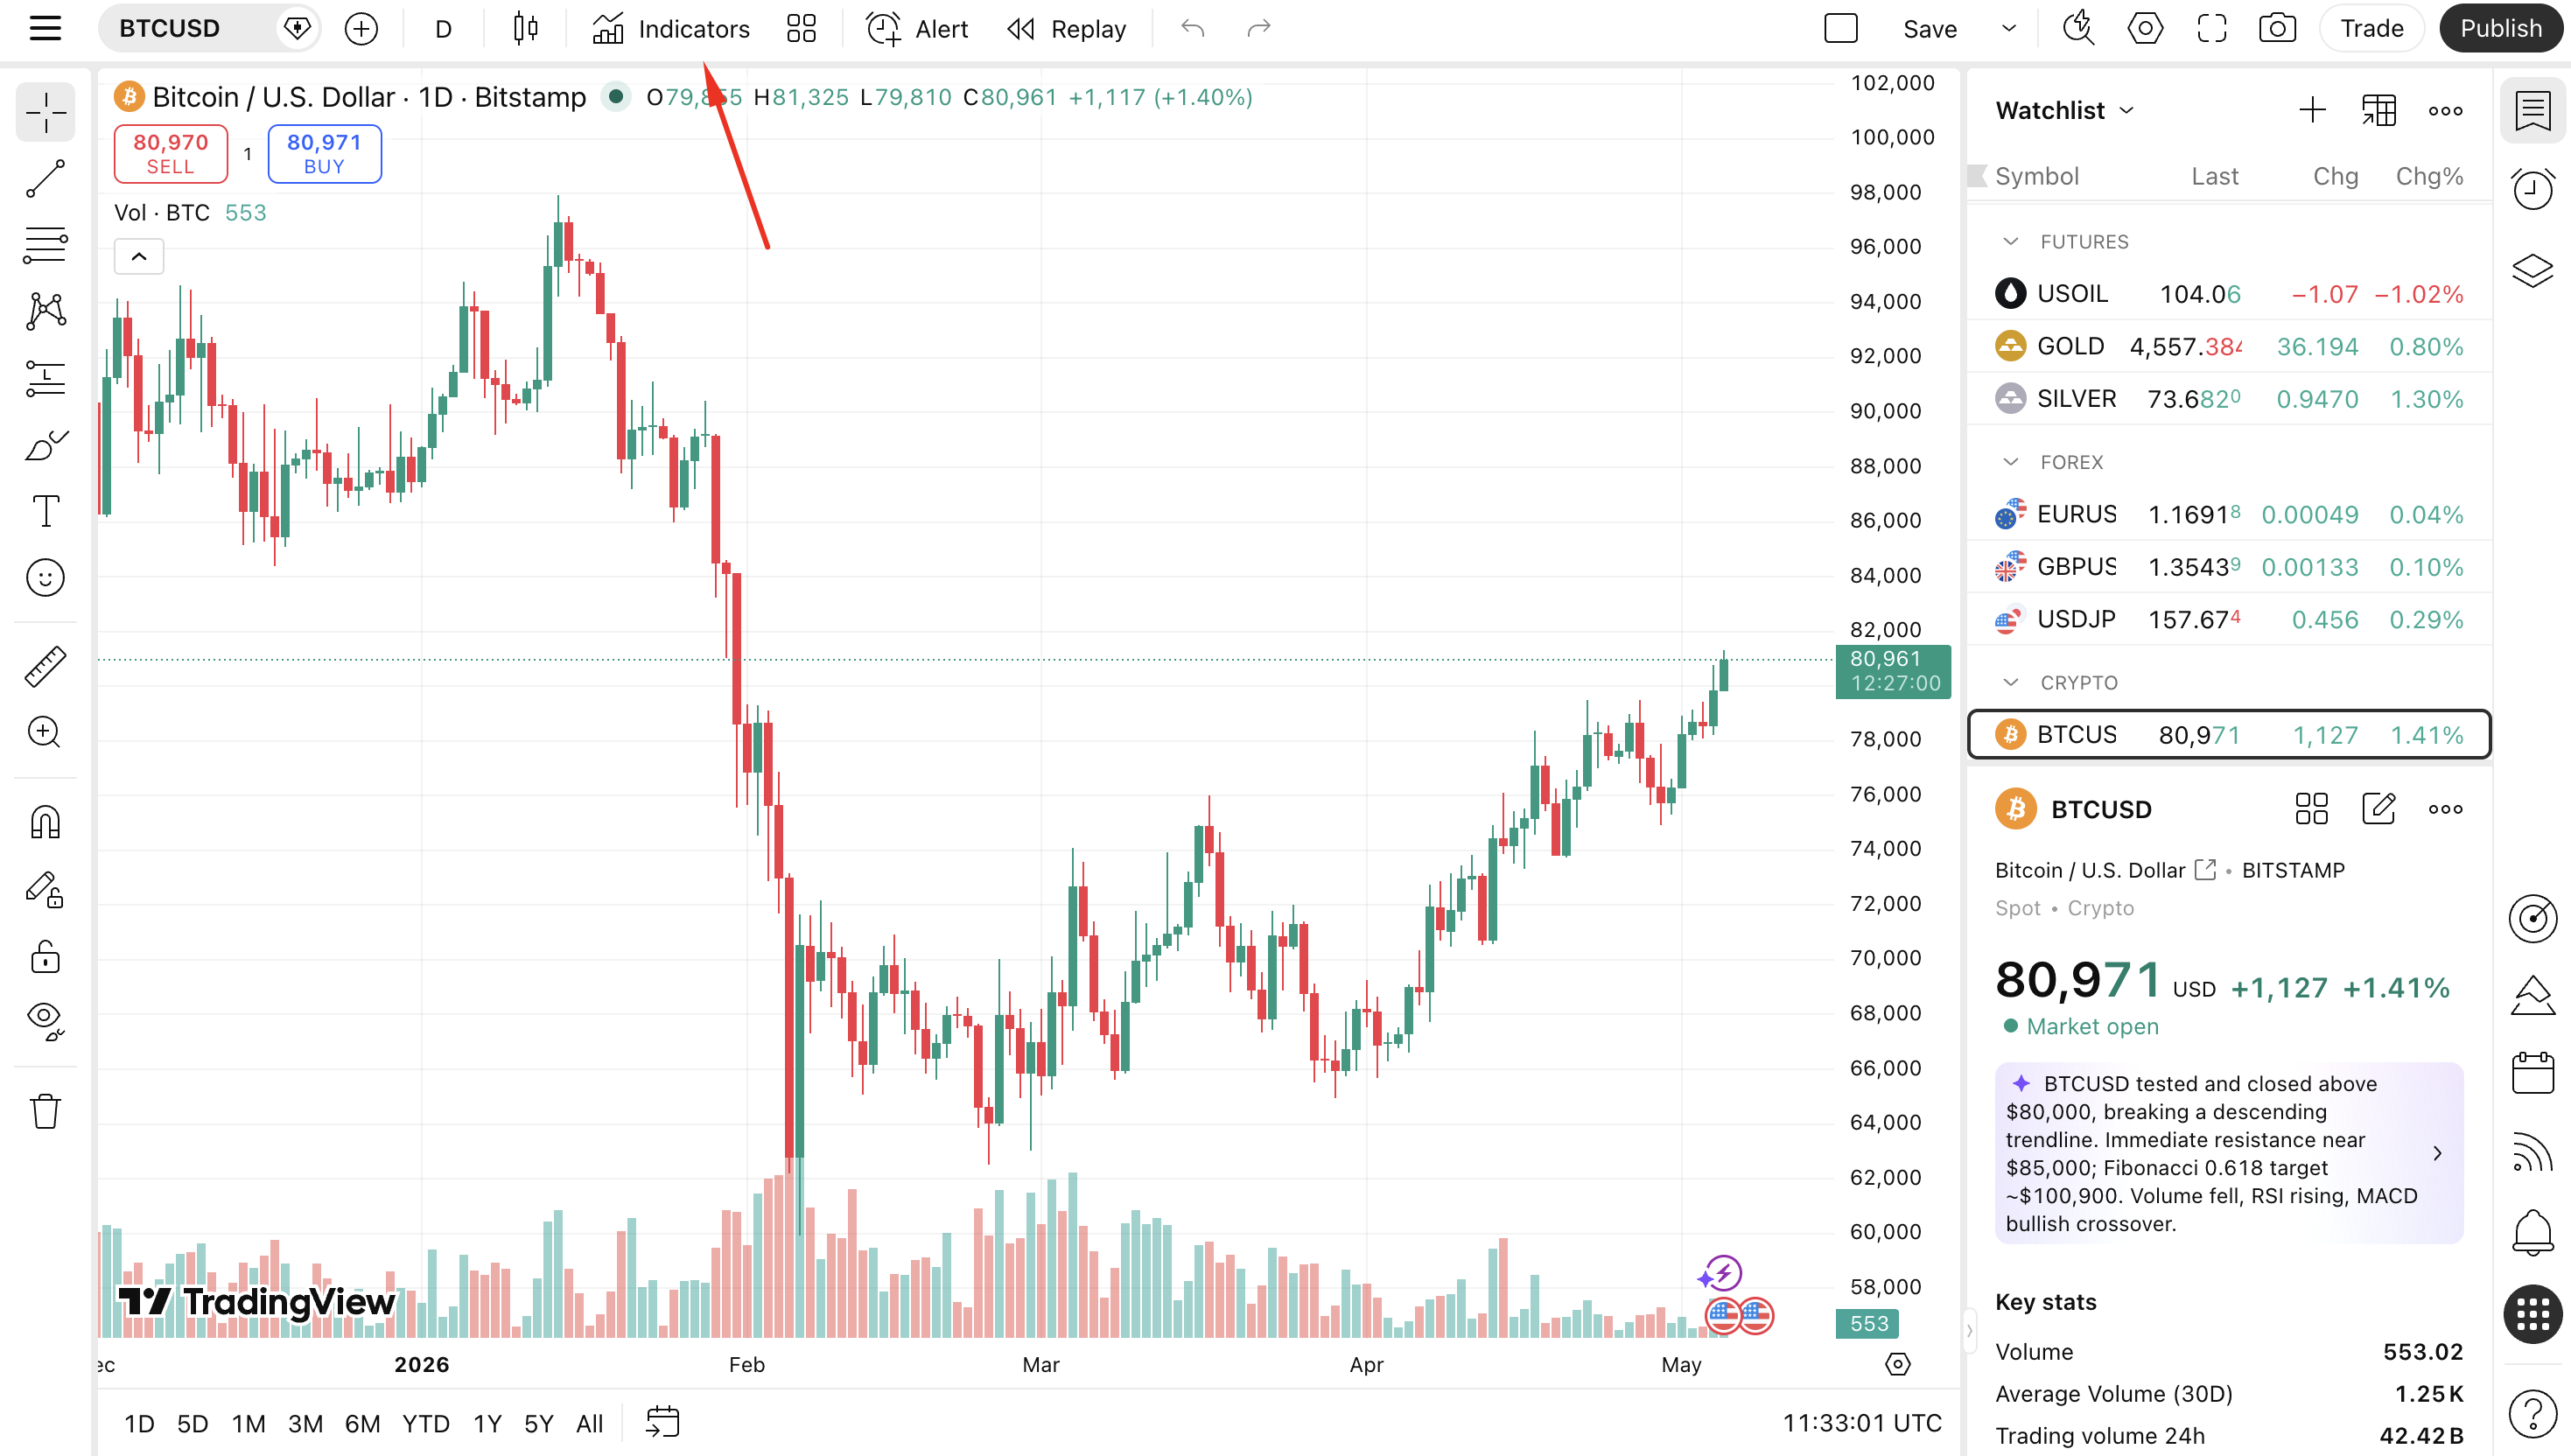
Step 2: Open the Indicators Panel
- Look at the top toolbar of the chart.
- Click the "Indicators" button — it looks like a small chart with a "f(x)" label, or simply says Indicators. It is located in the top-center of the chart toolbar.
- Alternatively, you can use the keyboard shortcut: press "/" on your keyboard to open the indicator search directly.
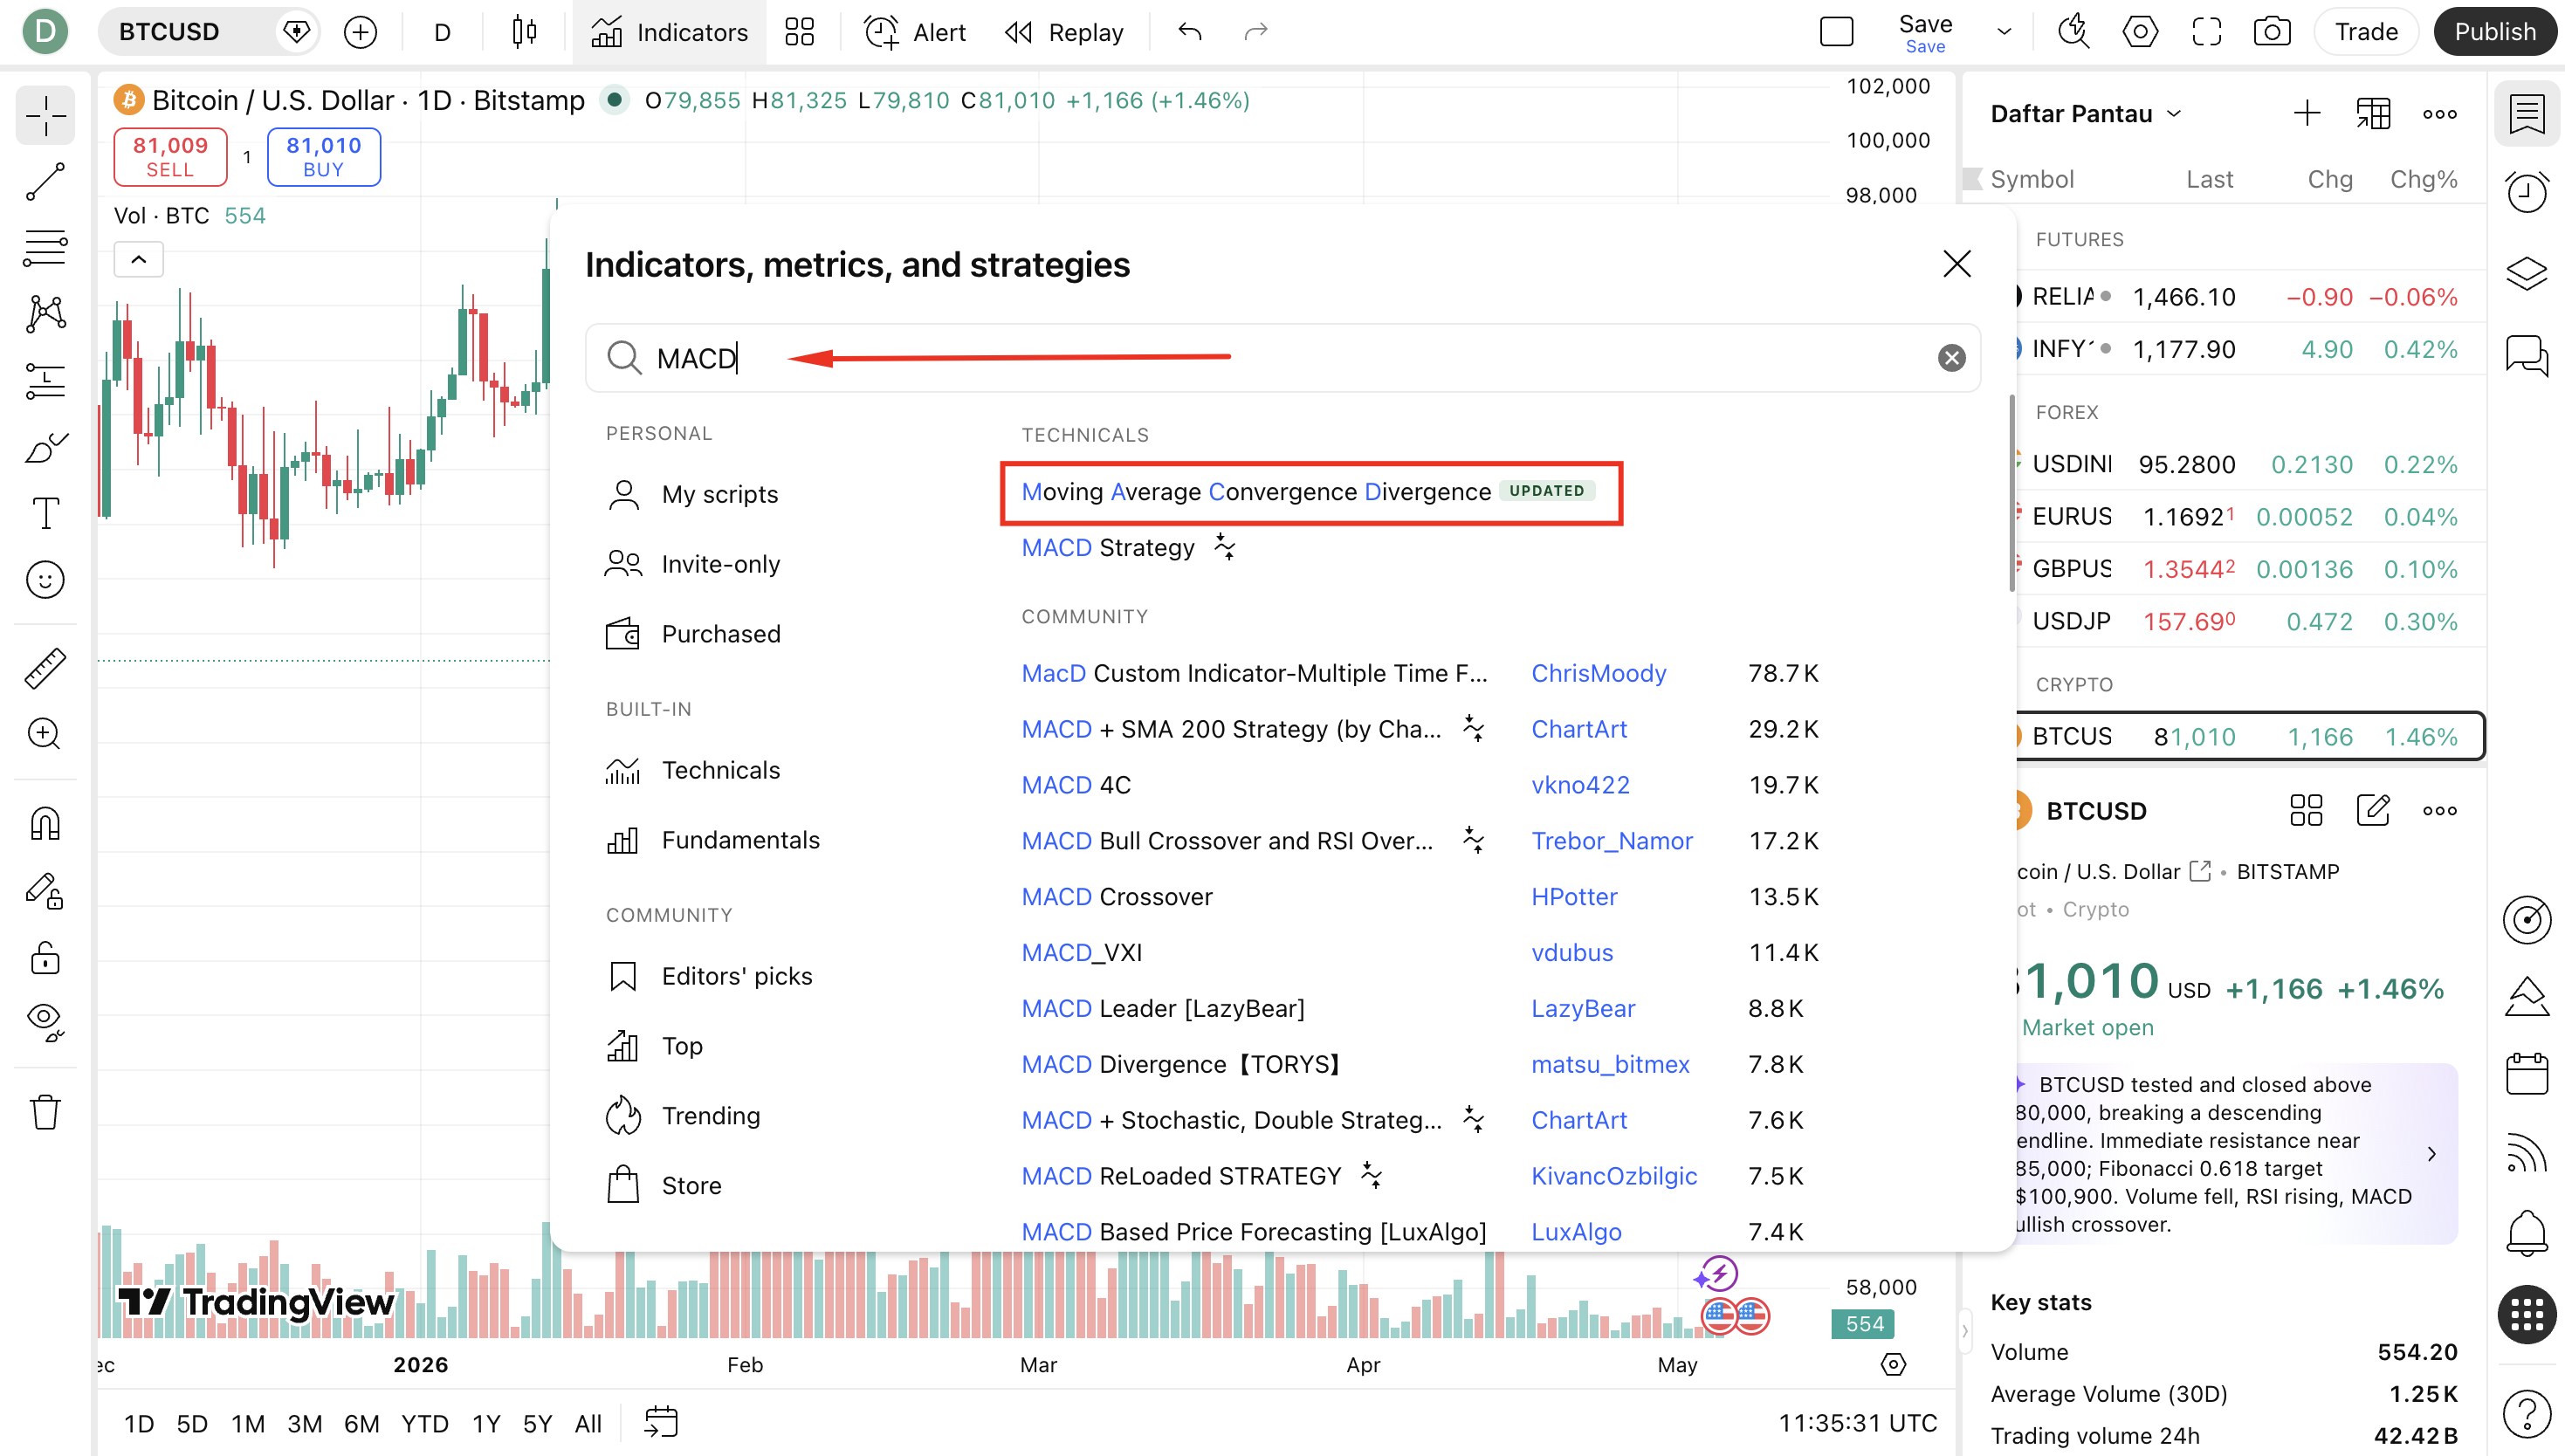
Step 3: Search for MACD
- The Indicator Search dialog will appear on your screen.
- In the search box at the top of the dialog, type "MACD".
- You will see a list of results. Look for "MACD" under the "Built-ins" section — this is the official TradingView version of the indicator.
- There will also be community scripts — for now, choose the built-in version for reliability.
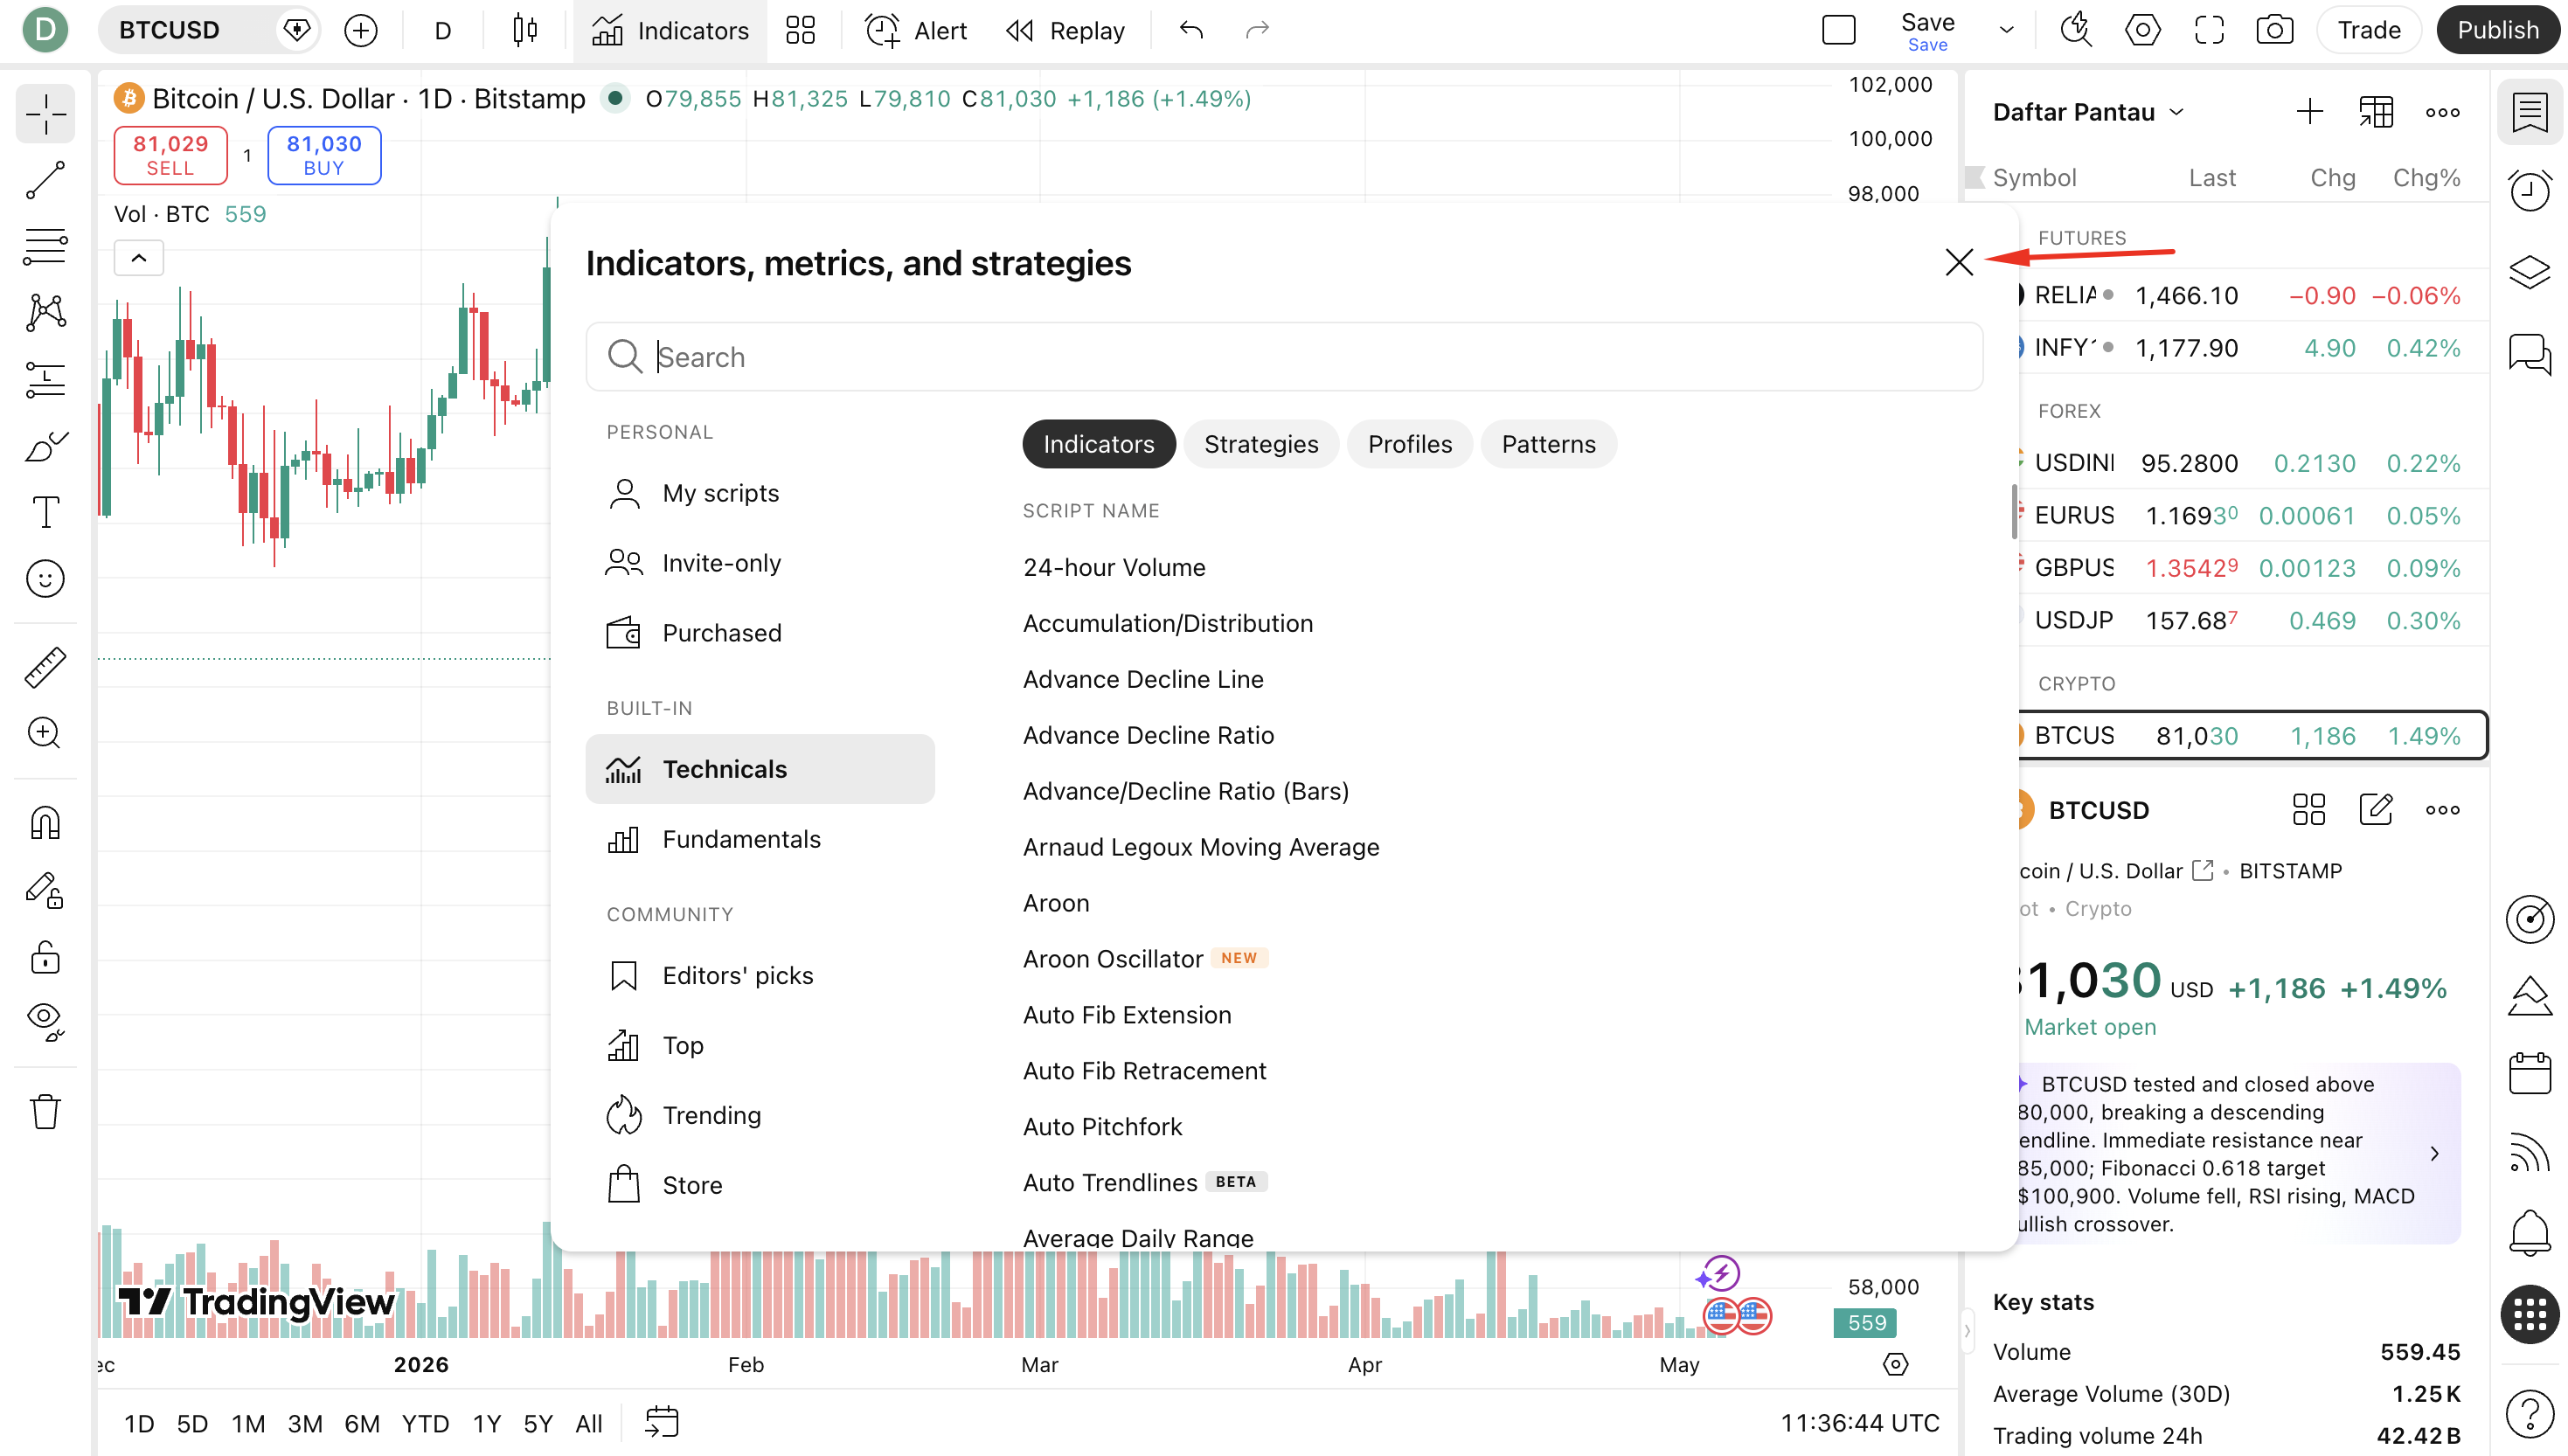
Step 4: Add MACD to Your Chart
- Click on "MACD" from the search results list.
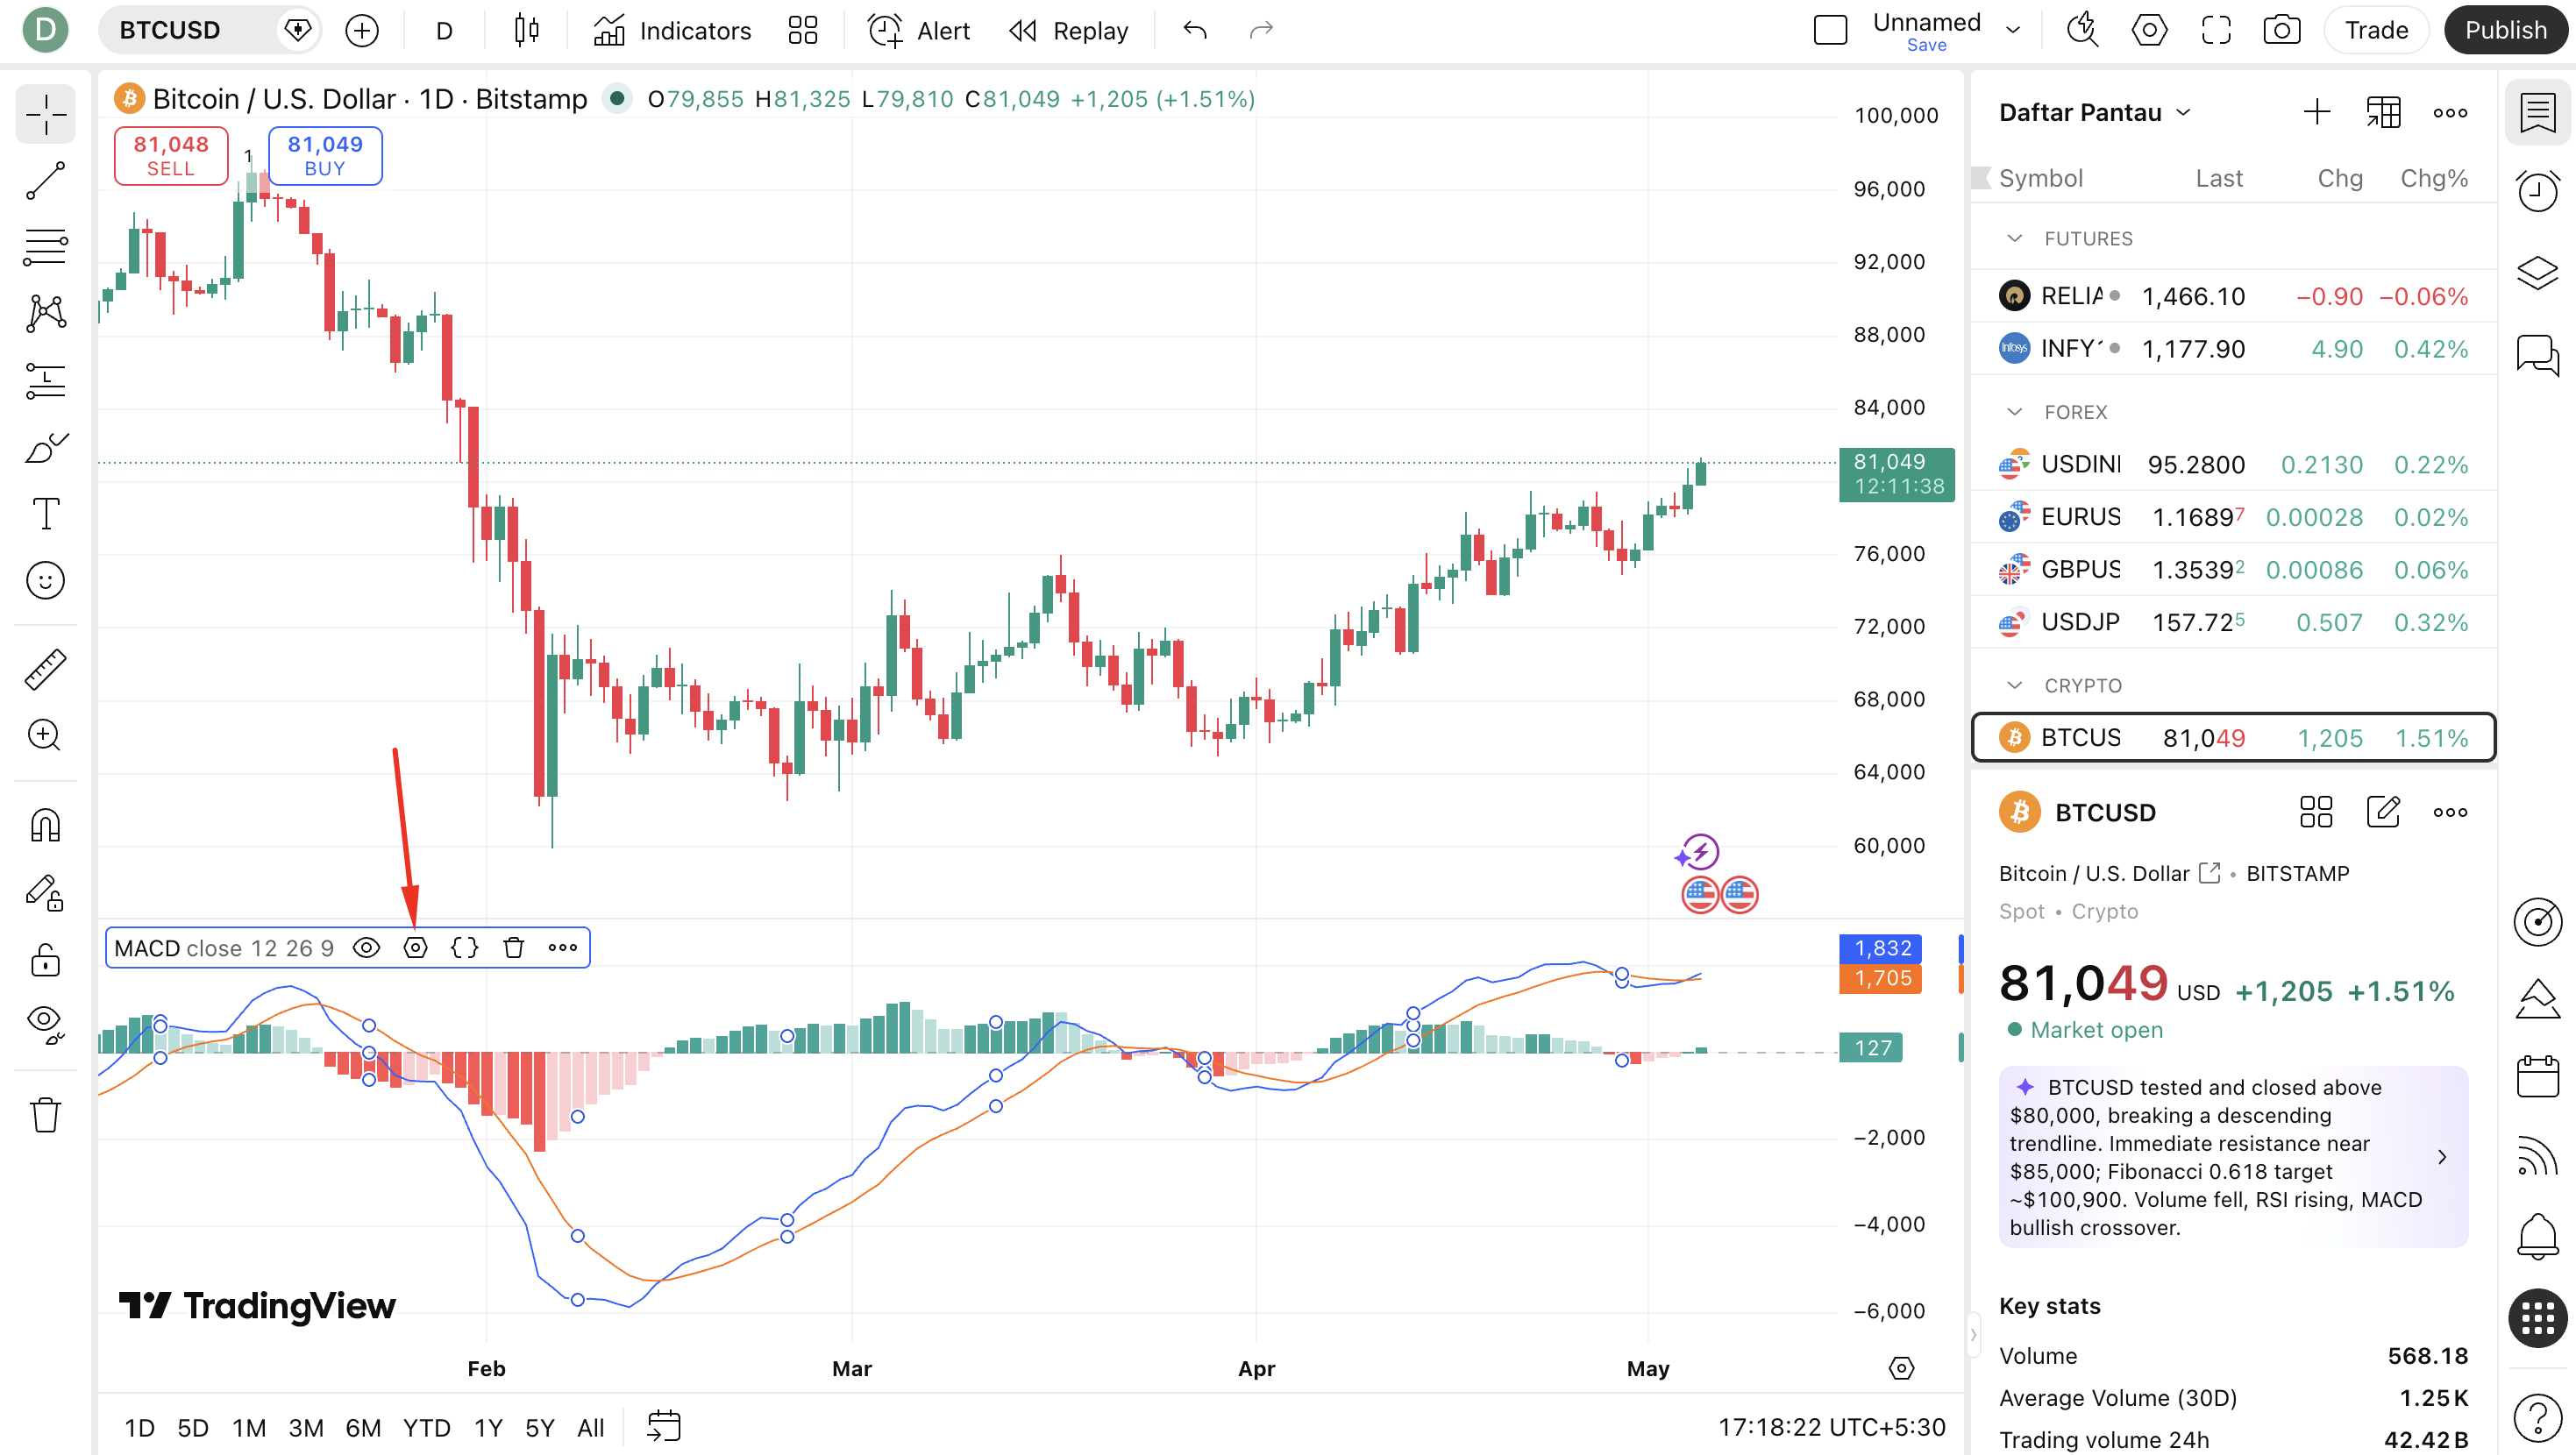
- The MACD indicator will immediately be added to a separate panel below your price chart.
- You will see three elements appear:
- The MACD Line (blue line)
- The Signal Line (orange line)
- The Histogram (green/red bars)
- Close the indicator search dialog by clicking the X button or clicking anywhere outside it.
Step 5: Open MACD Settings to Customize
- In the MACD panel, look at the top-left corner — you will see the label "MACD (12, 26, 9)".
- Hover over this label and a small gear icon (⚙) will appear next to it.
- Click the gear icon to open the settings dialog.
- Alternatively, you can double-click anywhere on the MACD panel to open settings.
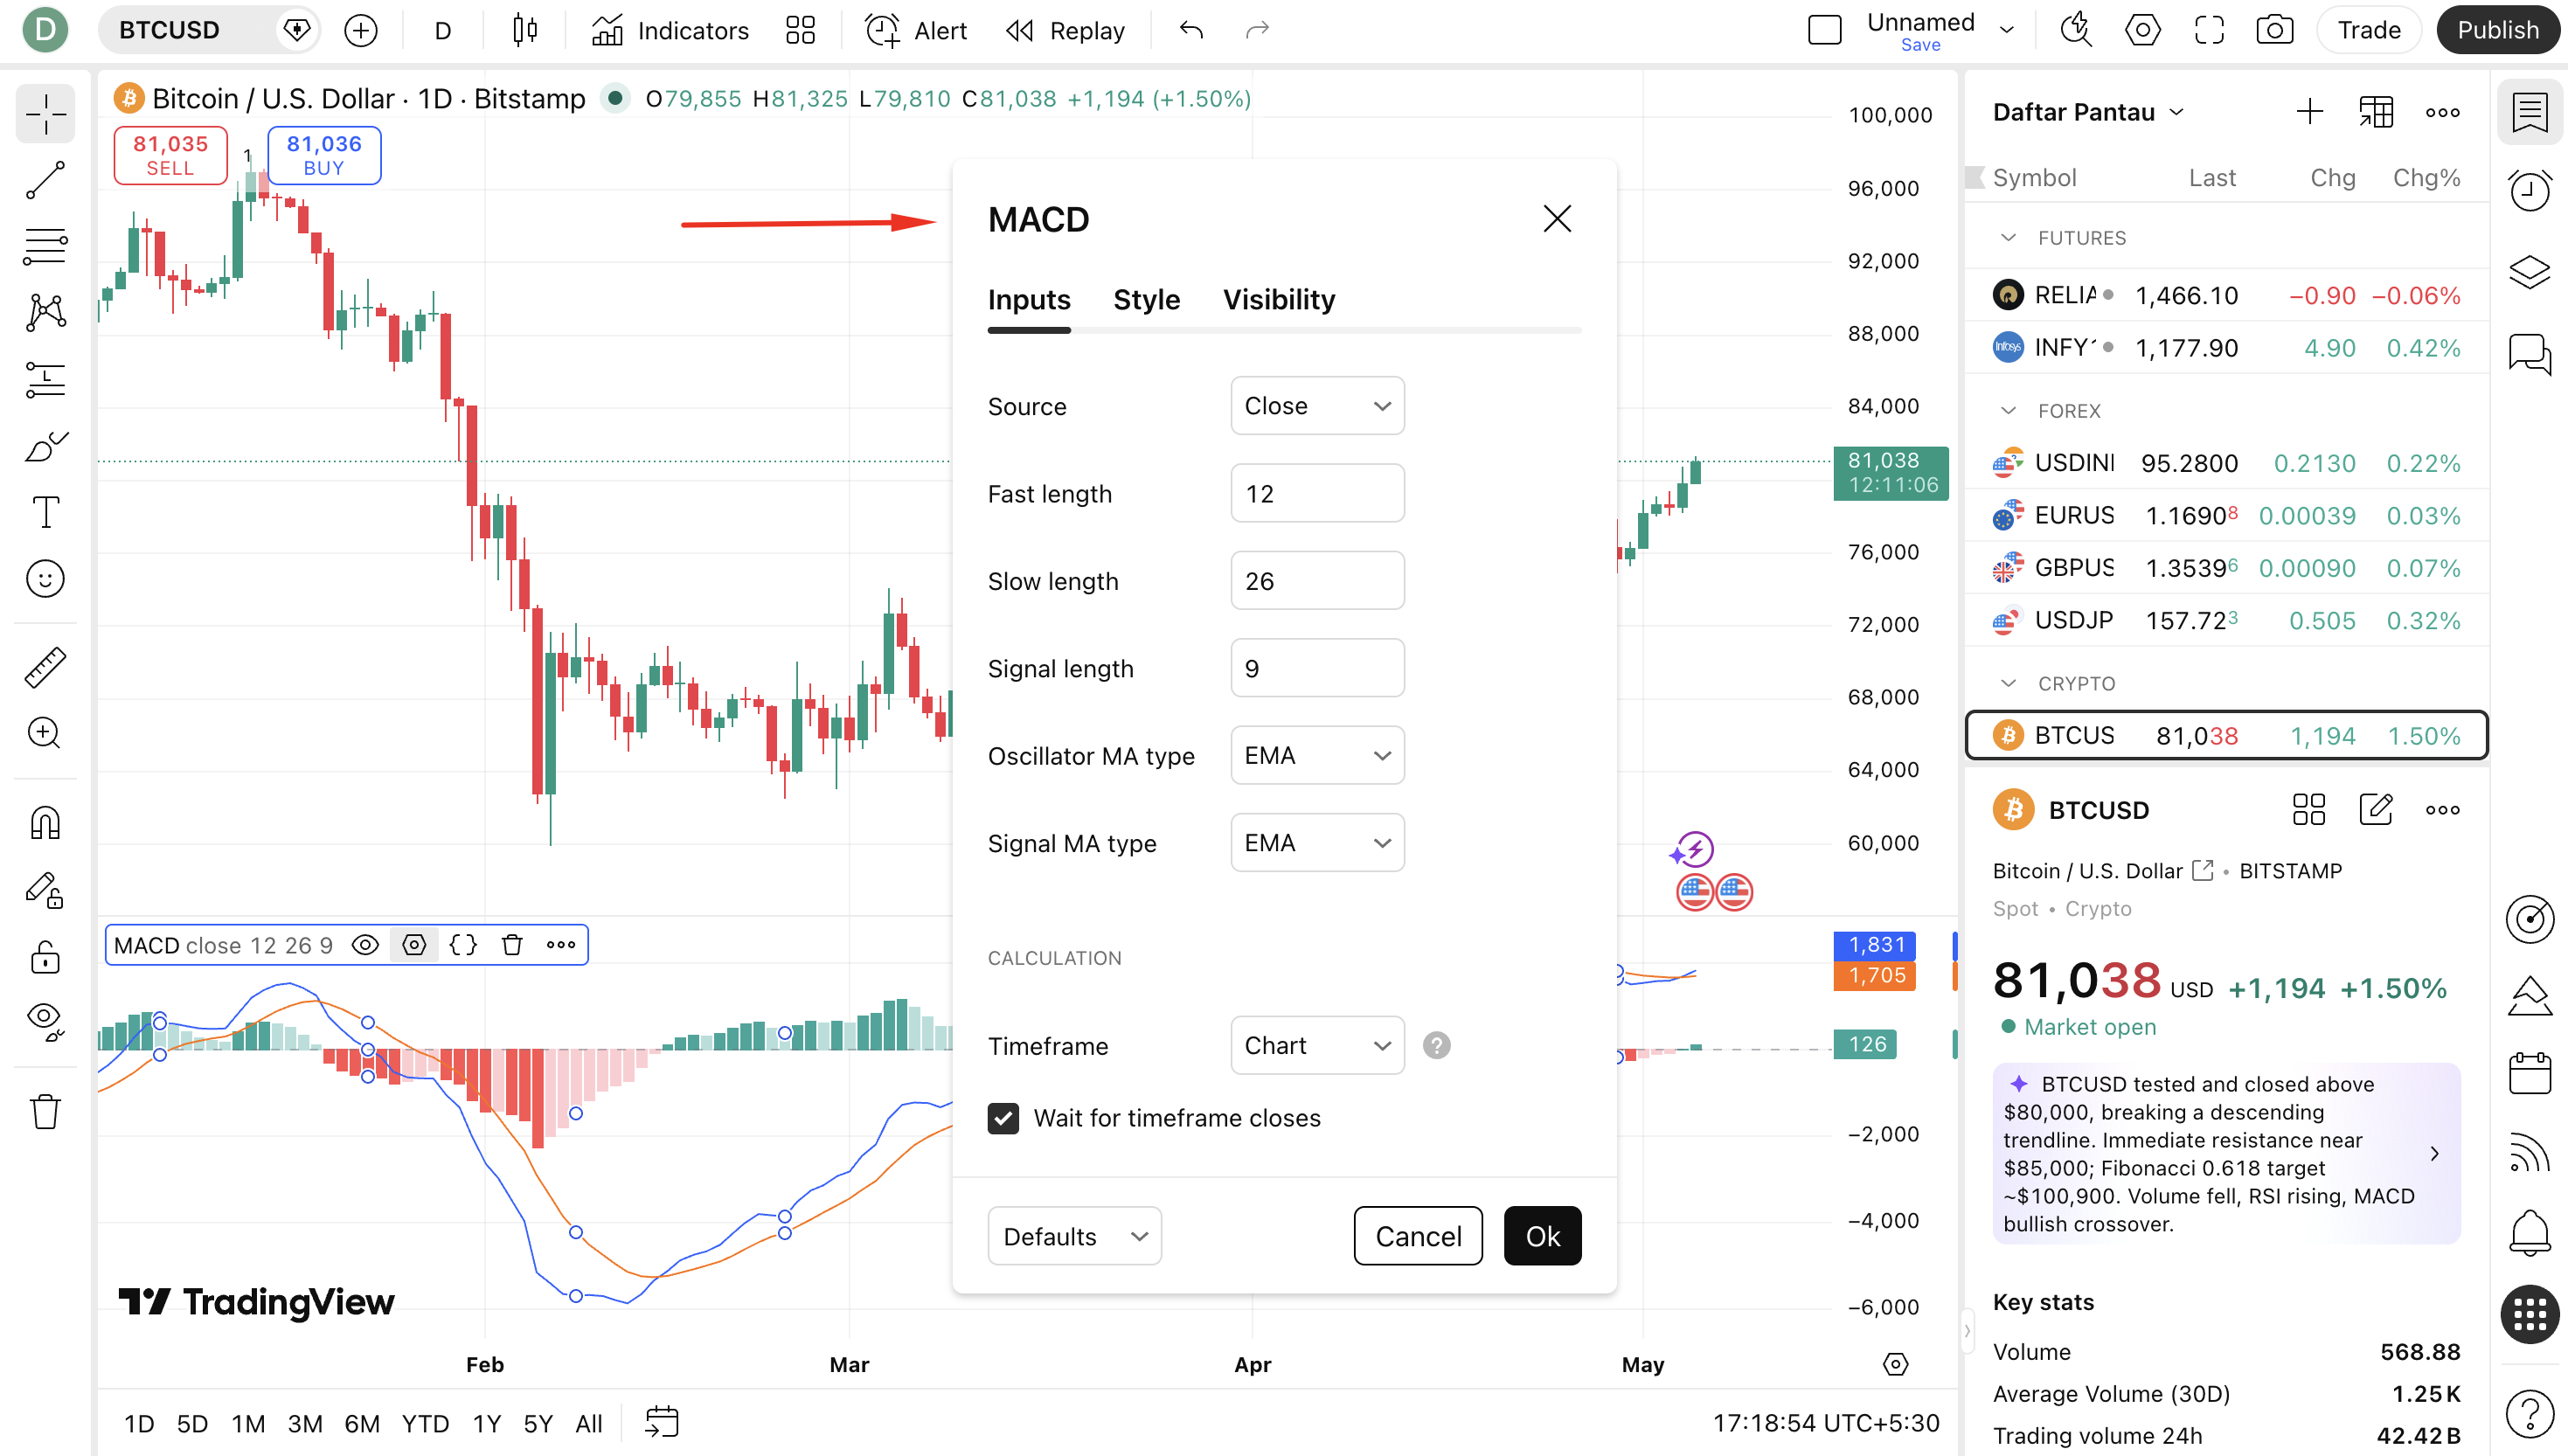
Step 6: Configure MACD Settings
The settings dialog has three tabs: Inputs, Style, and Visibility.
Inputs Tab:
- Fast Length: Default is 12. This controls the fast EMA period.
- Slow Length: Default is 26. This controls the slow EMA period.
- Signal Smoothing: Default is 9. This controls the signal line EMA period.
- Source: Default is Close. You can change it to Open, High, Low, HL2, etc.
- Oscillator MA Type: Set to EMA by default. Can be changed to SMA for a smoother MACD.
- Signal Line MA Type: EMA by default.
Style Tab:
- Change the color of the MACD Line, Signal Line, and Histogram bars
- Toggle histogram color between single color or dual (green for positive, red for negative)
- Adjust line thickness for better visibility
Visibility Tab:
- Control which timeframes the MACD appears on (e.g., only show on Daily and above)
Step 7: Apply and Confirm
- Once you have configured your settings, click the "OK" button to apply changes.
- Your MACD panel will update immediately to reflect the new settings.
- If you want to save this as your default for future charts, click "Set as Default" before clicking OK.
- To remove MACD from your chart, hover over the MACD panel, click the X (remove) icon next to the gear icon.
Step 8: Saving Your Chart Layout
- After setting up MACD, save your chart layout so it loads automatically next time.
- Click the floppy disk / save icon at the top-right of TradingView, or press Ctrl + S (Windows) / Cmd + S (Mac).
- Give your layout a name (e.g., "MACD Setup") and click Save.
- On your next visit, click the layout name in the top bar to restore your full setup instantly.
Quick Reference: TradingView MACD Setup Checklist
| Step | Action | Notes |
|---|---|---|
| 1 | Open TradingView and load a chart | Any symbol and timeframe |
| 2 | Click "Indicators" in top toolbar | Or press "/" shortcut |
| 3 | Search "MACD" in the dialog | Choose Built-in version |
| 4 | Click MACD to add it | Appears below price chart |
| 5 | Click gear icon to open settings | Or double-click the panel |
| 6 | Adjust Fast (12), Slow (26), Signal (9) | Customize to your style |
| 7 | Click OK to apply | "Set as Default" to save permanently |
| 8 | Save chart layout | Ctrl+S / Cmd+S |
MACD Settings & Customization for Different Trading Styles
Standard Settings (12, 26, 9)
The default settings work well for daily charts and swing traders. This is the most widely used configuration and provides a good balance between sensitivity and noise filtering.
Faster Settings for Day Traders (5, 13, 1 or 3, 10, 16)
Day traders on shorter timeframes (1-minute, 5-minute) often use faster settings to get quicker signals. Popular fast settings include (5, 13, 1) or (3, 10, 16). These react faster but generate more false signals.
Slower Settings for Investors (19, 39, 9 or 24, 52, 9)
Long-term investors and position traders use slower settings to filter out short-term noise. Settings like (19, 39, 9) provide smoother signals on weekly charts.
| Trading Style | Recommended Settings | Best Timeframe |
|---|---|---|
| Scalping | (3, 10, 16) or (5, 13, 1) | 1m, 3m, 5m |
| Day Trading | (8, 17, 9) or (12, 26, 9) | 15m, 30m, 1H |
| Swing Trading | (12, 26, 9) — Standard | 4H, Daily |
| Position Trading | (19, 39, 9) | Weekly, Monthly |
Pro Tips for Using MACD Effectively
Tip 1: Always Trade in the Direction of the Trend
Use a higher timeframe (e.g., daily) to identify the overall trend direction, then use MACD on a lower timeframe (e.g., 1-hour) for entry signals. Only take buy signals when the higher-timeframe trend is bullish, and sell signals when it is bearish.
Tip 2: Combine MACD with RSI
MACD and RSI (Relative Strength Index) complement each other perfectly. Use RSI to confirm overbought/oversold conditions and MACD for trend direction and crossover timing. When both confirm the same signal, trade confidence increases significantly.
Tip 3: Never Trade Divergence Without Confirmation
Divergence can persist for a long time before price actually reverses. Always wait for a price action confirmation — such as a break of a key support/resistance level, a reversal candlestick pattern, or a MACD line crossover — before entering based on divergence alone.
Tip 4: Watch the Histogram for Early Warning
The histogram often starts shrinking before the MACD Line and Signal Line actually cross. This gives you early warning of a potential signal — useful for preparing your trade without jumping in prematurely.
Tip 5: Avoid Using MACD in Sideways/Choppy Markets
MACD is a trend-following indicator and performs poorly in ranging, sideways markets. In these conditions, crossover signals become frequent and unreliable. Use MACD in trending markets and consider an oscillator like the Stochastic RSI for ranging conditions.
Tip 6: Use Multi-Timeframe MACD
Open MACD on both your trading timeframe and one or two higher timeframes. When all three timeframes show bullish MACD alignment (MACD above signal, histograms positive), trade confidence is at its highest. This technique is called multi-timeframe confluence.
Limitations of MACD
1. Lagging Indicator
Because MACD is based on moving averages, it is a lagging indicator — it reacts to price changes rather than predicting them. By the time a MACD crossover occurs, a significant portion of the move may already be complete. This is especially problematic in fast-moving, volatile markets.
2. False Signals in Choppy Markets
In sideways or choppy price action, MACD generates frequent crossovers that produce losing trades. It is essential to assess whether the market is trending before relying on MACD signals.
3. Not Useful for Overbought/Oversold Levels
Unlike RSI or Stochastic, MACD does not have fixed overbought/oversold levels. It is an unbounded oscillator, meaning extreme readings are relative and context-dependent — making it harder to define when a move has gone "too far."
4. Parameter Sensitivity
Changing the input parameters dramatically changes the signals MACD produces. Using different settings on the same chart can give completely opposite signals — so traders must be disciplined and consistent with their chosen settings.
Conclusion
The MACD indicator has earned its place as one of the most essential tools in technical analysis — not because it is perfect, but because it provides a remarkably clear picture of momentum and trend direction in a simple, visual format that is easy to read and act on.
From its invention by Gerald Appel in 1979 to its global adoption on every major trading platform today, MACD has proven its value across generations of traders, markets, and timeframes. Whether you are a beginner learning to read charts or a professional trader building complex strategies, understanding MACD deeply gives you a meaningful edge.
The key is to use MACD as part of a broader trading system — combining it with trend analysis, price action, and risk management — rather than relying on it in isolation. When used correctly, MACD is not just an indicator; it is a window into the underlying momentum of the market.
Start with the default (12, 26, 9) settings on TradingView, study how the signals align with price action, and gradually build your own understanding of how MACD behaves in different market conditions. Happy trading!
Frequently Asked Questions
How do I add MACD on TradingView?▼
To add MACD on TradingView: (1) Open a chart on TradingView.com; (2) Click the 'Indicators' button in the top toolbar; (3) Search for 'MACD' in the search box; (4) Click on 'MACD' under Built-ins; (5) It will automatically appear below your price chart. You can customize settings by clicking the gear icon next to the MACD label.
Can MACD be used for all markets and timeframes?▼
Yes. MACD is universal — it works on stocks, forex, cryptocurrency, commodities, indices, and ETFs. It also works across all timeframes, from 1-minute scalping charts to monthly investment charts. However, shorter timeframes generate more noise and false signals, so it is important to combine MACD with other analysis tools on faster timeframes.
How do I read MACD signals?▼
There are four main MACD signals: (1) MACD/Signal line crossover — when MACD crosses above the signal line it is bullish, below is bearish; (2) Zero line crossover — MACD crossing above zero confirms a bullish trend; (3) Divergence — when price and MACD move in opposite directions, signaling a potential reversal; (4) Histogram momentum shift — shrinking bars indicate weakening momentum.
Related Blogs

RSI Indicator: The Complete Guide — History, How It Works & TradingView Setup
A professional, in-depth guide to the RSI (Relative Strength Index) indicator — covering its history, how it works, overbought and oversold signals, divergence, and a step-by-step walkthrough to add and configure RSI on TradingView.

Moving Average Indicator: The Complete Guide — SMA, EMA, WMA, VWMA & TradingView Setup
A professional, in-depth guide to Moving Average indicators — covering the history, types (SMA, EMA, WMA, VWMA, DEMA, TEMA, HMA), how each works, trading signals, and a full step-by-step walkthrough to add and configure Moving Averages on TradingView.