RSI Indicator: The Complete Guide — History, How It Works & TradingView Setup
A professional, in-depth guide to the RSI (Relative Strength Index) indicator — covering its history, how it works, overbought and oversold signals, divergence, and a step-by-step walkthrough to add and configure RSI on TradingView.

RSI Indicator: The Complete Guide
The Relative Strength Index (RSI) is one of the most popular and trusted momentum oscillators in technical analysis. Used by millions of traders worldwide across stocks, forex, crypto, and commodities, RSI helps identify overbought and oversold conditions, spot divergence, and time entries and exits with precision. This guide covers everything you need to know — from its origins to a full TradingView setup walkthrough.
What Is RSI?
The Relative Strength Index (RSI) is a momentum oscillator that measures the speed and magnitude of recent price changes to evaluate whether an asset is currently overbought or oversold. It oscillates between 0 and 100, making it easy to read at a glance.
Developed by J. Welles Wilder Jr. in 1978, RSI has become a cornerstone of modern technical analysis. Unlike trend-following indicators such as moving averages, RSI is a momentum indicator — it tells you not just which direction price is moving, but how fast and how strongly it is moving in that direction.
"RSI is not just about overbought and oversold levels — it is a complete picture of market momentum, trend strength, and potential reversal points all in one number."
History of RSI
The Creator: J. Welles Wilder Jr.
J. Welles Wilder Jr. was an American mechanical engineer turned technical analyst and trader. Born in 1935, Wilder became one of the most influential figures in the history of technical analysis — not just for RSI, but for a suite of powerful indicators he developed in the late 1970s.
Wilder introduced the RSI indicator in his landmark 1978 book "New Concepts in Technical Trading Systems" — a groundbreaking work that also introduced the Average True Range (ATR), Directional Movement Index (DMI/ADX), and the Parabolic SAR. The book was self-published and became an instant classic among traders and analysts worldwide.
The Motivation Behind RSI
Wilder was frustrated with existing momentum indicators of the era, which were prone to erratic swings and difficult to interpret consistently. He wanted to create a normalized momentum oscillator — one that always stayed within a fixed range (0 to 100) regardless of the asset's price level, making it easy to compare across different markets and timeframes.
His solution was to measure the ratio of average gains to average losses over a set period, then smooth that ratio into a 0–100 scale. The result was an indicator that was both mathematically elegant and practically powerful.
Evolution and Standardization
After Wilder's original publication, other analysts further refined RSI's interpretation. Andrew Cardwell, a student of Wilder's work in the 1980s and 1990s, made significant contributions by developing the concept of RSI range rules and positive and negative reversals — advanced RSI concepts that showed the indicator could signal trend continuation, not just reversals.
Today, RSI is a standard feature on every major trading and charting platform in the world, and it remains one of the top five most-used technical indicators globally.
| Year | Milestone |
|---|---|
| 1935 | J. Welles Wilder Jr. born in Norris, Tennessee |
| 1978 | RSI introduced in "New Concepts in Technical Trading Systems" |
| 1980s | RSI adopted widely by institutional and retail traders |
| 1990s | Andrew Cardwell develops advanced RSI range rules and reversals |
| 2000s | RSI becomes a default indicator on all charting software |
| Present | One of the top 5 most-used technical indicators worldwide |
Why Is RSI Useful?
1. Identifies Overbought and Oversold Conditions
RSI's primary use is identifying when an asset has been pushed too far in one direction. When RSI rises above 70, the asset may be overbought and due for a pullback. When it falls below 30, the asset may be oversold and due for a bounce. These levels give traders clear, objective reference points for evaluating price extremes.
2. Works Across All Markets and Timeframes
RSI is universally applicable — it works equally well on stocks, forex pairs, commodities, cryptocurrencies, indices, and ETFs. It also adapts to any timeframe, from 1-minute scalping charts to monthly long-term investment charts.
3. Spots Divergence Early
One of RSI's most valuable features is its ability to reveal divergence — when price and RSI move in opposite directions. This is often one of the earliest signals of a trend exhaustion and potential reversal, giving traders advance warning before price actually turns.
4. Measures Trend Strength
Beyond overbought/oversold signals, RSI also reveals the underlying strength of a trend. In a strong bull trend, RSI consistently stays in the 40–80 range. In a bear trend, it stays in the 20–60 range. Recognizing these "RSI ranges" helps traders stay aligned with the dominant trend.
5. Simple and Intuitive
RSI produces a single number between 0 and 100. This simplicity makes it easy for traders of all experience levels to read, interpret, and act on — without needing to understand complex mathematics.
6. Combines Powerfully With Other Indicators
RSI pairs exceptionally well with MACD (for momentum confirmation), Bollinger Bands (for volatility context), and moving averages (for trend direction). Using RSI as part of a multi-indicator system dramatically improves signal quality and trade confidence.
How RSI Works
RSI measures the ratio of recent gains to recent losses over a specified period, then converts that ratio into a value between 0 and 100. Here is the step-by-step calculation:
Step 1: Choose the Period
The default RSI period is 14 — meaning it looks at the last 14 price bars (candles). This was the period Wilder originally specified and remains the most widely used setting.
Step 2: Calculate Average Gain and Average Loss
For each of the 14 periods, identify whether the close was higher (a gain) or lower (a loss) than the previous close.
Average Gain = Sum of gains over 14 periods ÷ 14Average Loss = Sum of losses over 14 periods ÷ 14
Step 3: Calculate Relative Strength (RS)
RS = Average Gain ÷ Average Loss
Step 4: Calculate RSI
RSI = 100 − (100 ÷ (1 + RS))
Step 5: Smooth the Values (Wilder Smoothing)
After the initial 14-period calculation, Wilder applied his own smoothing method — now known as the Wilder Moving Average (RMA) — to subsequent values. This smoothing method gives more weight to the most recent data while retaining influence from all prior periods, producing a smoother RSI line than a simple average would.
Smoothed Average Gain = (Previous Avg Gain × 13 + Current Gain) ÷ 14Smoothed Average Loss = (Previous Avg Loss × 13 + Current Loss) ÷ 14
Interpreting the Result
The final RSI value always falls between 0 and 100. A value of 100 would mean prices closed higher every single period — maximum buying momentum. A value of 0 would mean prices closed lower every single period — maximum selling momentum. In practice, RSI rarely reaches either extreme.
RSI Components Explained
1. The RSI Line
The RSI line is the main element — a single curved line that moves between 0 and 100. It rises when recent gains outpace recent losses, and falls when recent losses dominate. The slope and speed of the line reveal how quickly momentum is changing.
2. The Overbought Level (70)
When the RSI line rises above 70, the asset is considered overbought — meaning the recent upward price movement has been unusually strong and a correction or pullback may be coming. However, in a very strong bull trend, RSI can remain above 70 for extended periods.
3. The Oversold Level (30)
When RSI falls below 30, the asset is considered oversold — the recent downward move has been unusually sharp and a relief rally or reversal may occur. Like the overbought level, RSI can stay below 30 for long periods in a strong downtrend.
4. The Midline (50)
The 50 level acts as a momentum divider. RSI above 50 suggests buyers are in control — bullish momentum dominates. RSI below 50 suggests sellers have the upper hand — bearish momentum dominates. Many traders use the 50-line crossing as a trend confirmation signal.
| RSI Level | Interpretation | Implication |
|---|---|---|
| Above 70 | Overbought | Potential pullback or reversal |
| 50–70 | Bullish momentum | Buyers in control, trend is up |
| 50 | Neutral midpoint | Momentum equilibrium |
| 30–50 | Bearish momentum | Sellers in control, trend is down |
| Below 30 | Oversold | Potential bounce or reversal |
RSI Trading Signals
Signal 1: Overbought and Oversold (Classic Signal)
The most basic RSI signal is the overbought/oversold reading.
- Sell/Short Signal: RSI rises above 70 and then crosses back below 70 — this "exit from overbought" is the actual sell trigger, not merely touching 70.
- Buy/Long Signal: RSI falls below 30 and then crosses back above 30 — this "exit from oversold" is the actual buy trigger.
Important: Do not simply sell when RSI hits 70 or buy when it hits 30. In strong trends, price can remain overbought or oversold for a long time. Wait for RSI to cross back through the level before acting.
Signal 2: RSI Centerline Crossover
The 50 midline crossover is a trend confirmation signal:
- Bullish Signal: RSI crosses above 50 — buyers have taken control and the short-term trend is bullish.
- Bearish Signal: RSI crosses below 50 — sellers have taken control and the short-term trend is bearish.
This signal is particularly useful for trend traders who want to enter early in a new trend move rather than waiting for extreme overbought/oversold levels.
Signal 3: RSI Divergence (Most Powerful Signal)
Divergence is widely considered the most powerful RSI signal because it reveals exhaustion in the current trend before price confirms the reversal.
- Bullish Divergence: Price makes a lower low on the chart, but RSI makes a higher low. This means downward momentum is weakening even as price continues to fall — a reversal to the upside is likely approaching.
- Bearish Divergence: Price makes a higher high, but RSI makes a lower high. Upward momentum is fading even as price reaches new highs — a pullback or reversal downward is likely.
Hidden Divergence (Trend Continuation):
- Bullish Hidden Divergence: Price makes a higher low, but RSI makes a lower low — signals trend continuation upward.
- Bearish Hidden Divergence: Price makes a lower high, but RSI makes a higher high — signals trend continuation downward.
Signal 4: RSI Failure Swings
Failure swings are a concept introduced by Wilder himself and are considered highly reliable reversal signals. They occur entirely within the RSI indicator — independent of price action.
- Bullish Failure Swing: RSI falls below 30 (oversold), bounces back above 30, pulls back but stays above 30 (higher low), then breaks above the previous bounce high. This break is the buy signal.
- Bearish Failure Swing: RSI rises above 70 (overbought), drops back below 70, rallies but stays below 70 (lower high), then breaks below the previous drop low. This break is the sell signal.
| Signal Type | Bullish Condition | Bearish Condition | Reliability |
|---|---|---|---|
| Overbought/Oversold | RSI exits below 30 back above 30 | RSI exits above 70 back below 70 | Moderate |
| Centerline Crossover | RSI crosses above 50 | RSI crosses below 50 | Moderate |
| Regular Divergence | Price lower low / RSI higher low | Price higher high / RSI lower high | High (with confirmation) |
| Hidden Divergence | Price higher low / RSI lower low | Price lower high / RSI higher high | High (trend continuation) |
| Failure Swing | Bullish failure swing pattern | Bearish failure swing pattern | Very High |
How to Add RSI on TradingView — Step by Step
TradingView is the most popular charting platform in the world, and adding RSI takes less than a minute. Follow these detailed steps to get RSI fully set up and customized on your chart.
Step 1: Open TradingView and Load a Chart
- Open your browser and go to www.tradingview.com.
- Log in to your account. If you do not have one, create a free account — it takes under two minutes.
- Click "Chart" in the top navigation bar to open the full charting interface.
- In the symbol search box at the top left of the chart, type the ticker or name of the asset you want to analyze — for example, NIFTY 50, RELIANCE, BTCUSDT, EURUSD, or any stock.
- Select your preferred timeframe from the toolbar (e.g., 1D for daily, 1H for hourly, 15 for 15-minute).

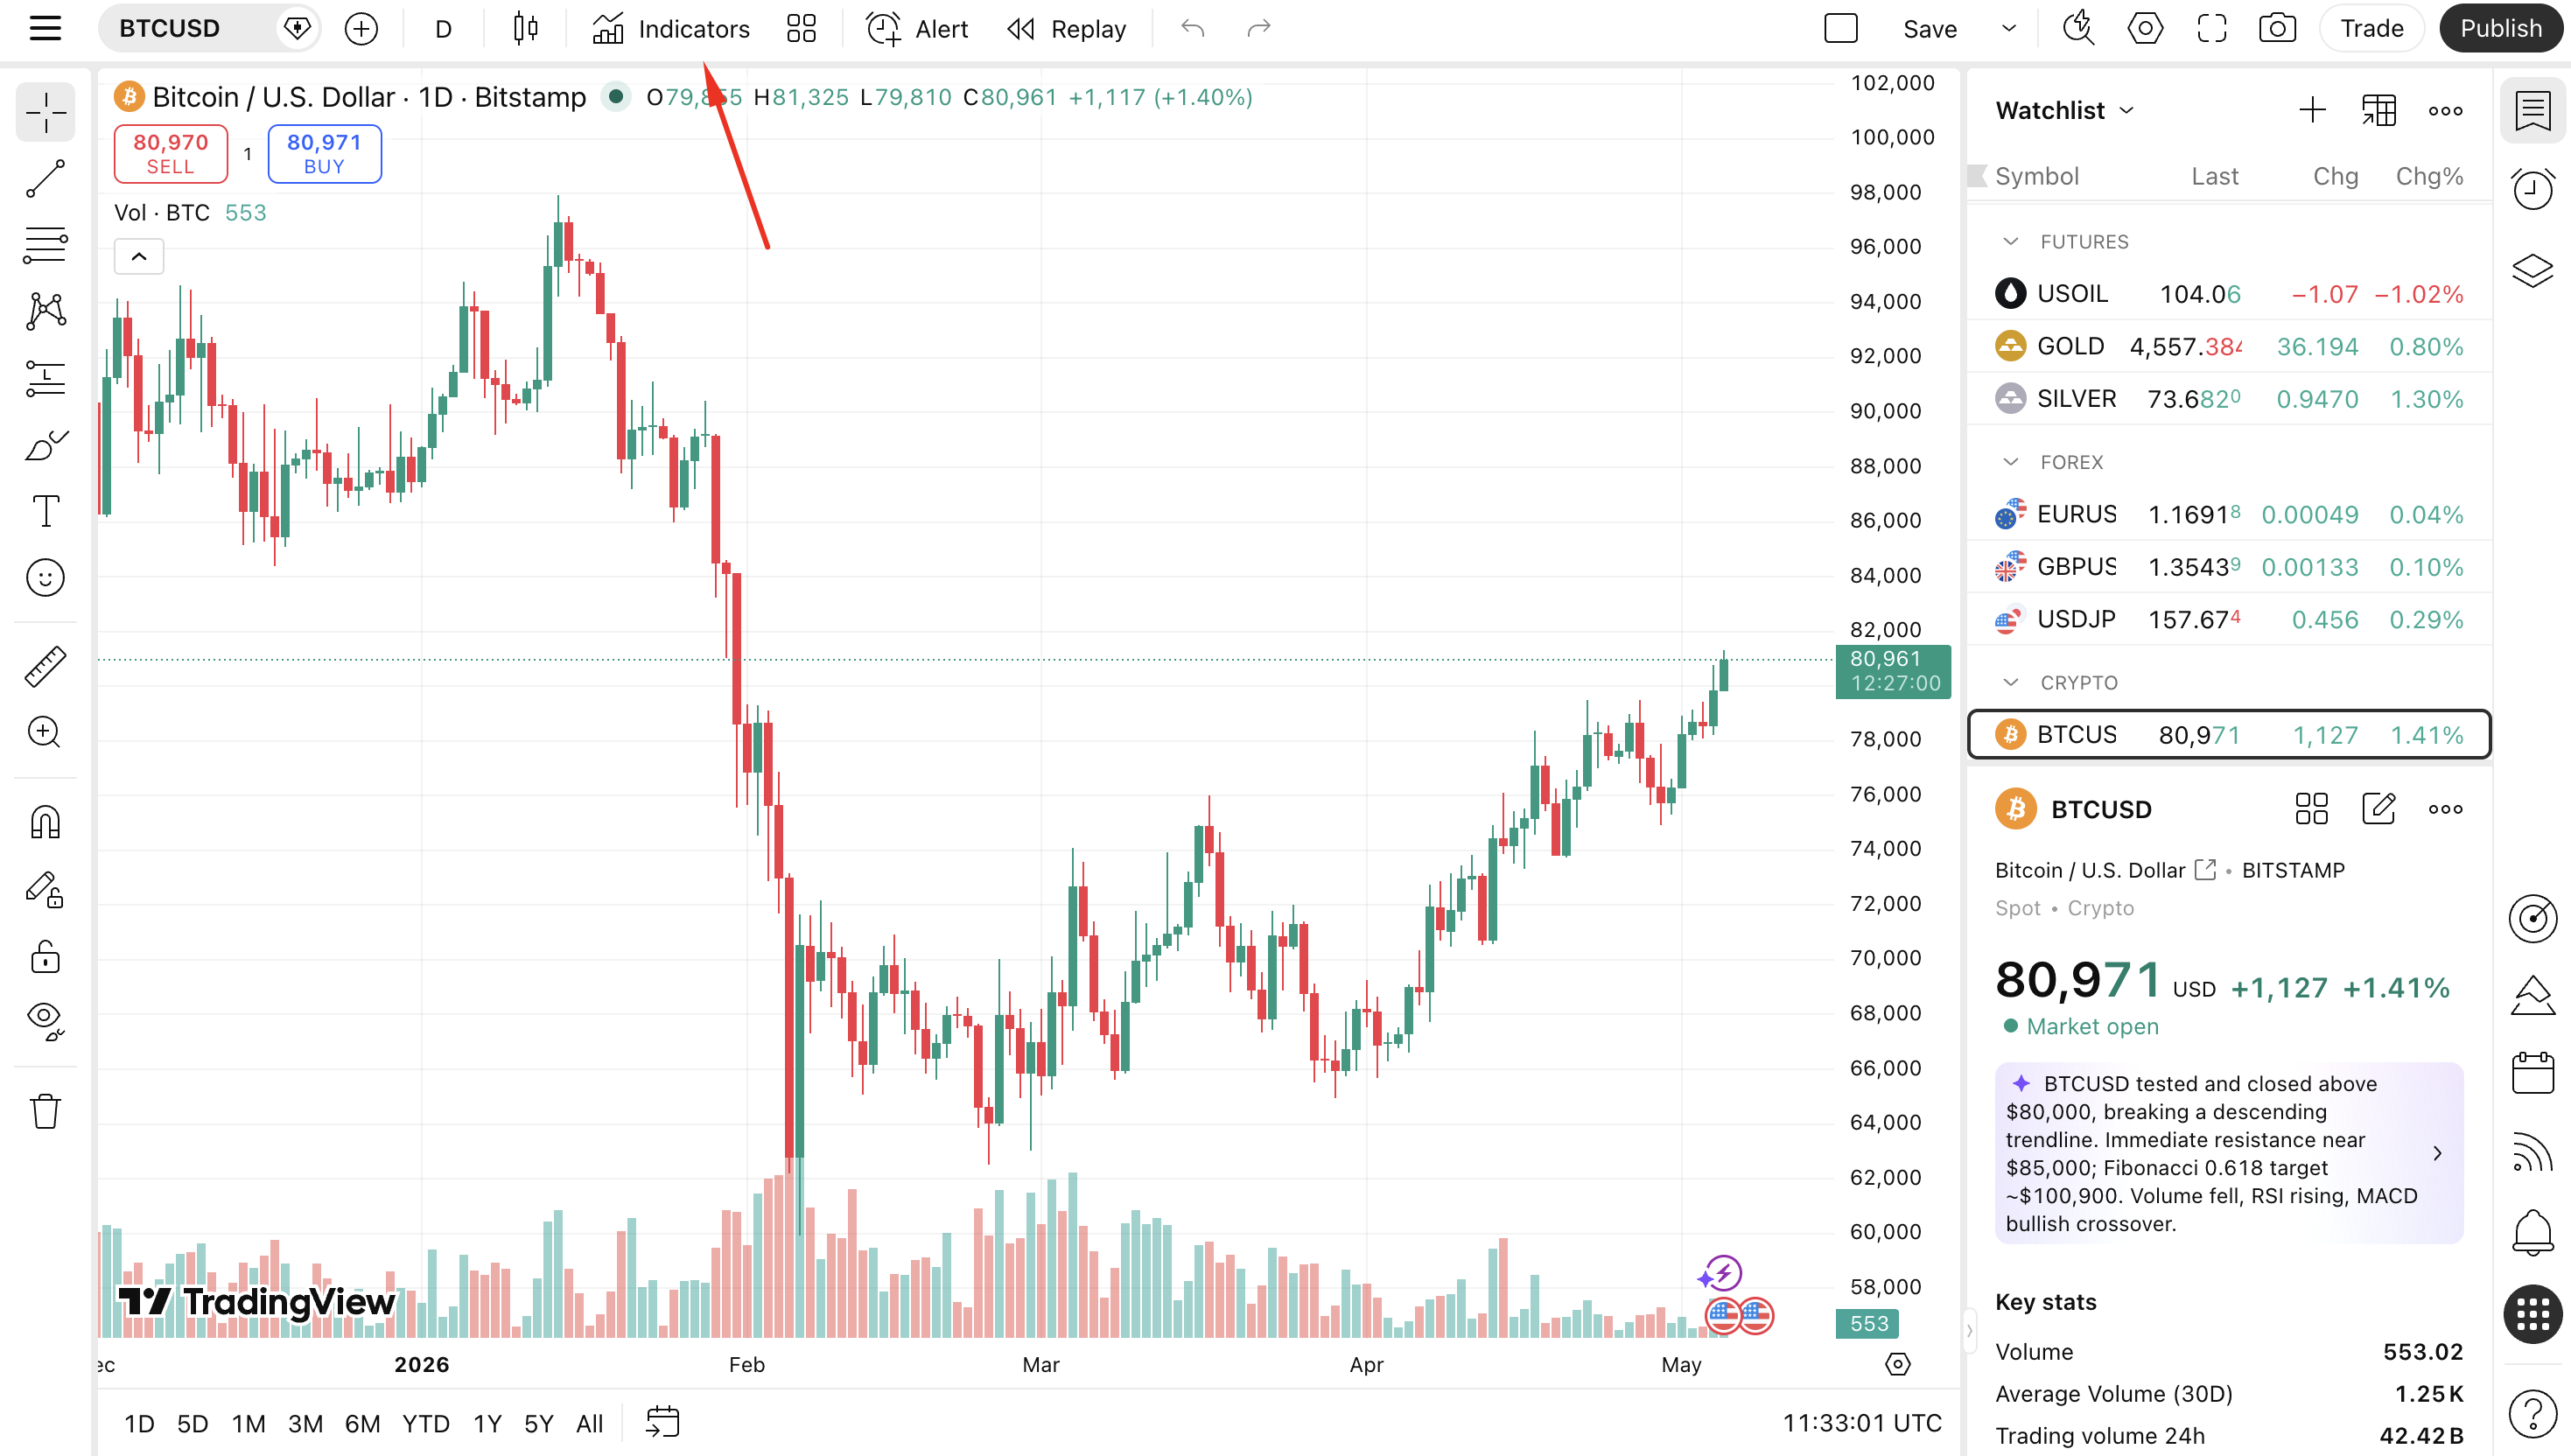
Step 2: Click the Indicators Button
- Look at the top toolbar above your chart.
- Find and click the "Indicators" button — it is labeled with a small chart icon and the text Indicators or f(x), located in the center-top of the toolbar.
- A large indicator search dialog will open immediately.
- Keyboard shortcut: Press "/" on your keyboard to open the indicator search dialog instantly without using the mouse.
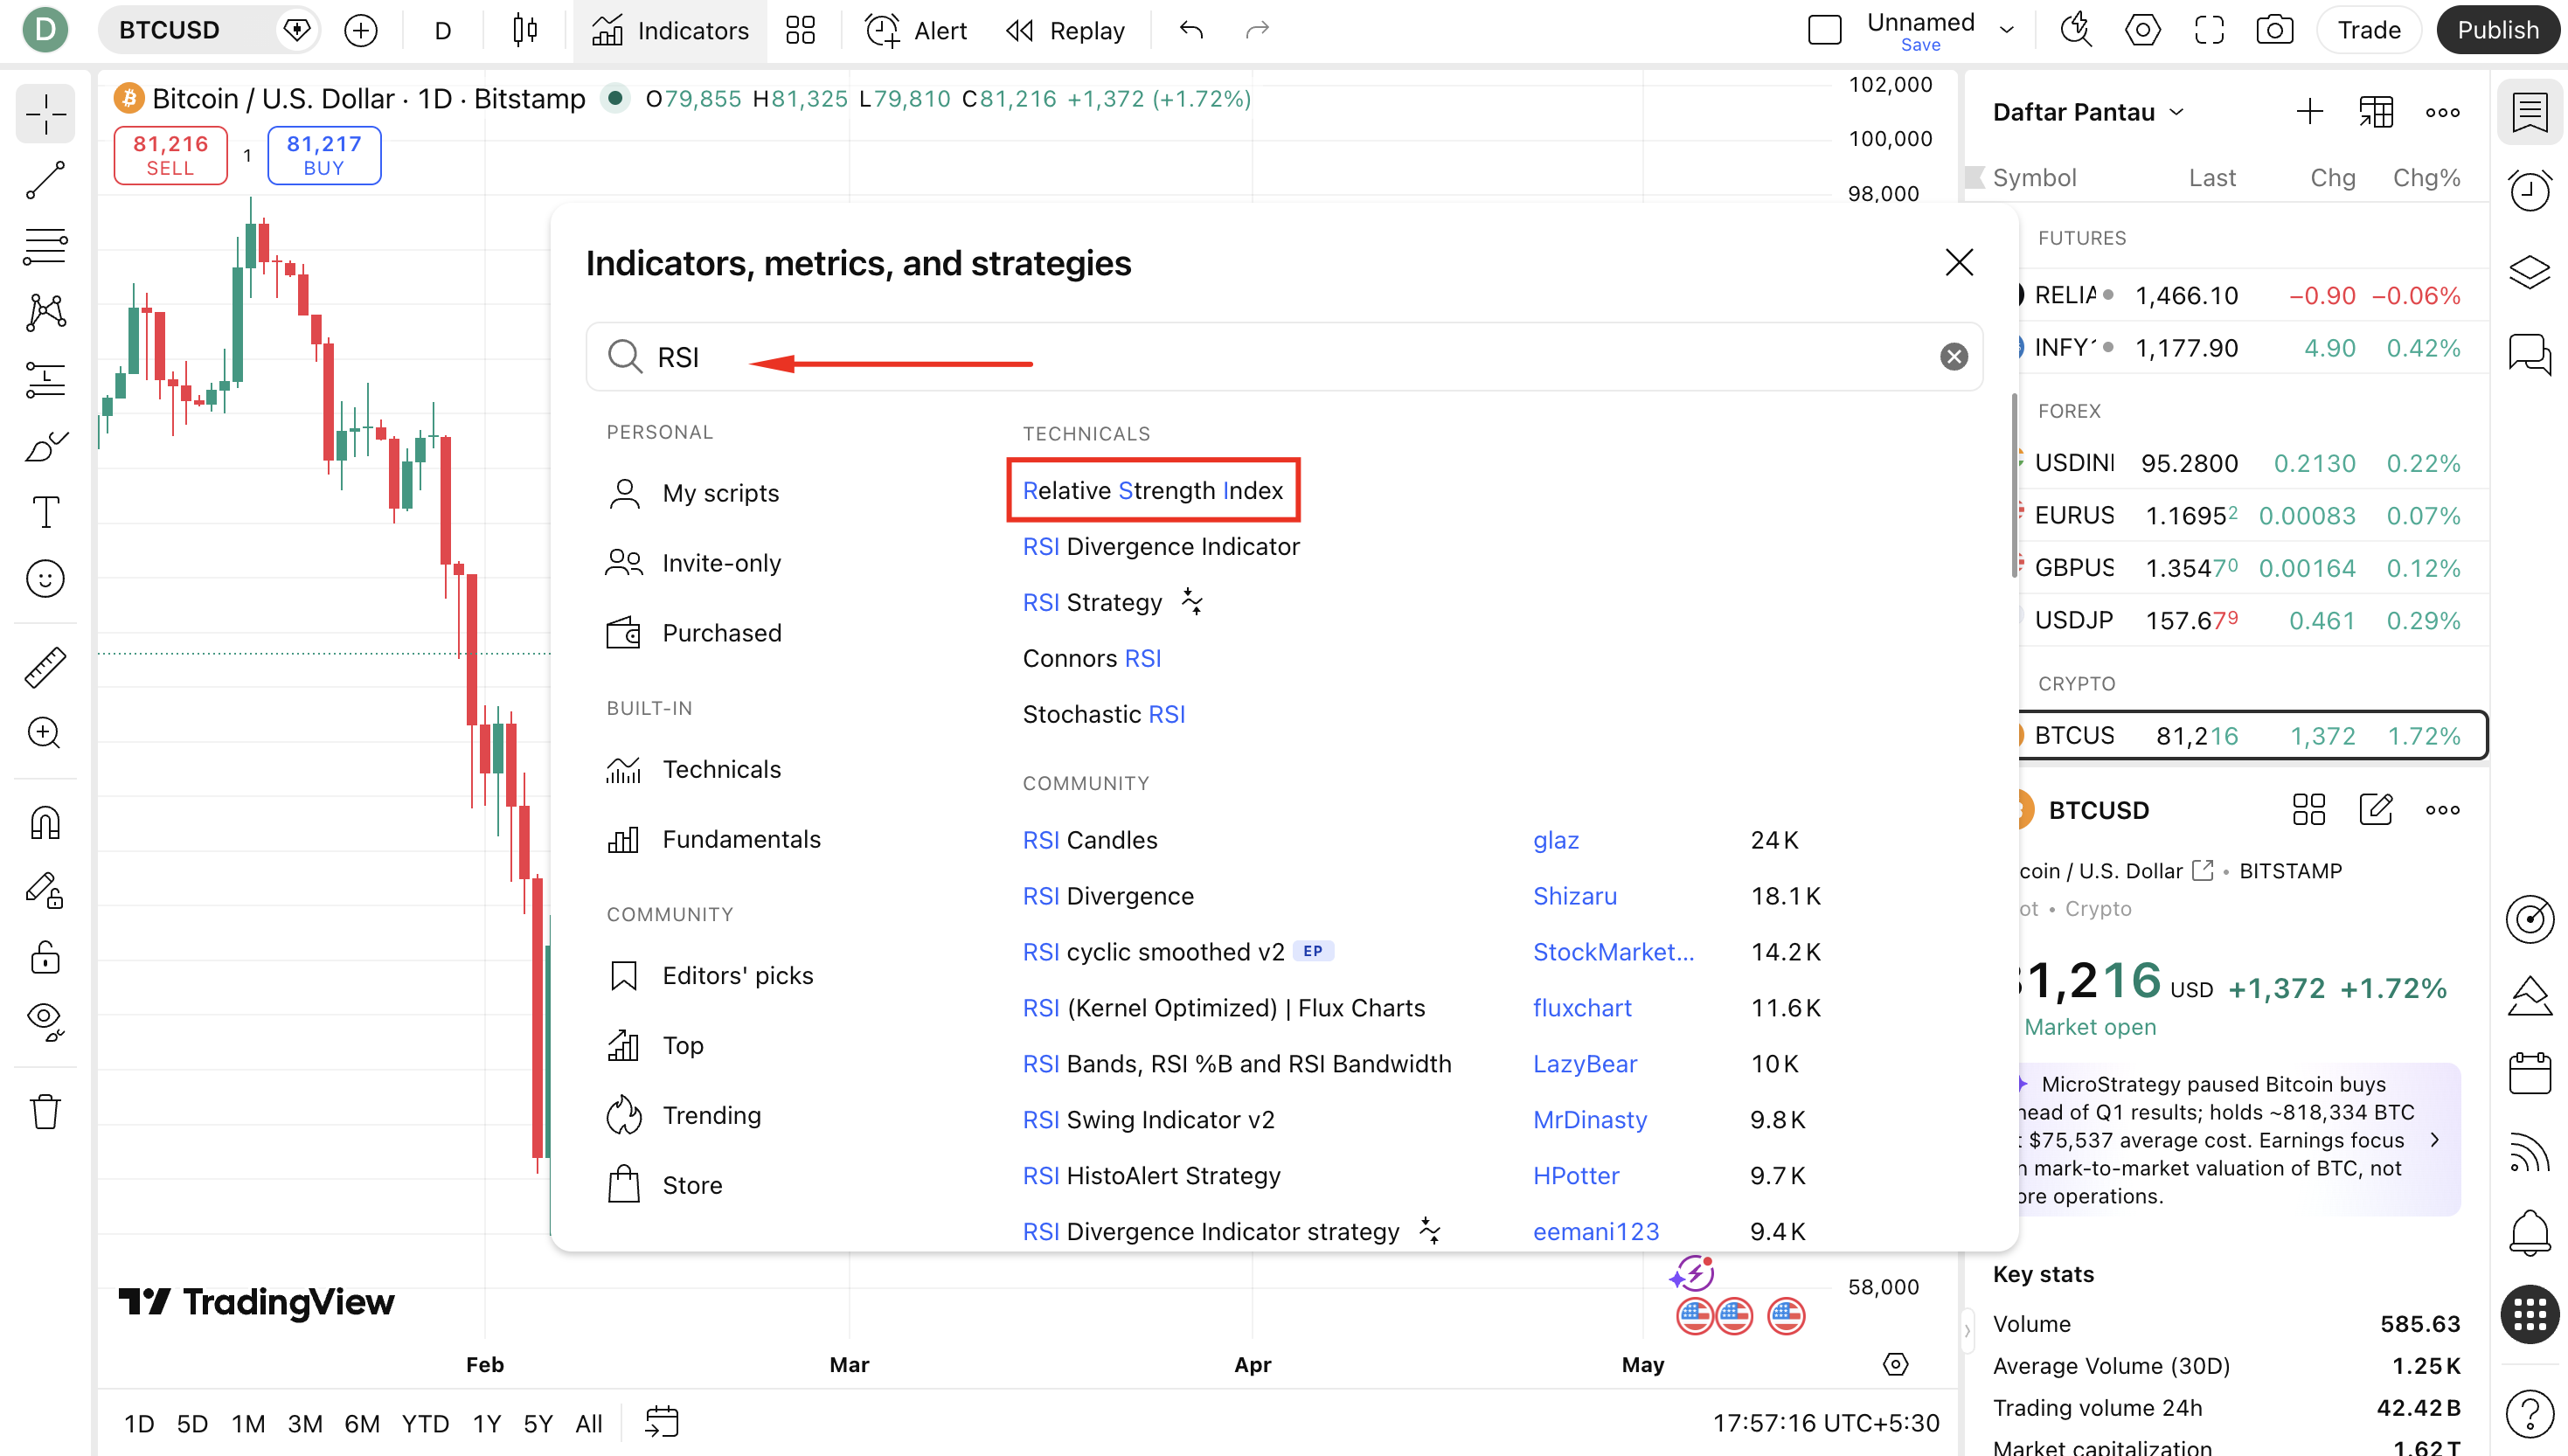
Step 3: Search for RSI
- The Indicator Search dialog will appear over your chart.
- In the search field at the top of the dialog, type "RSI".
- A list of results will appear. Look for "Relative Strength Index" listed under the "Built-ins" section — this is the official, reliable TradingView version.
- You may also see community RSI scripts — these can be useful for advanced customization, but for standard use, always start with the built-in version.
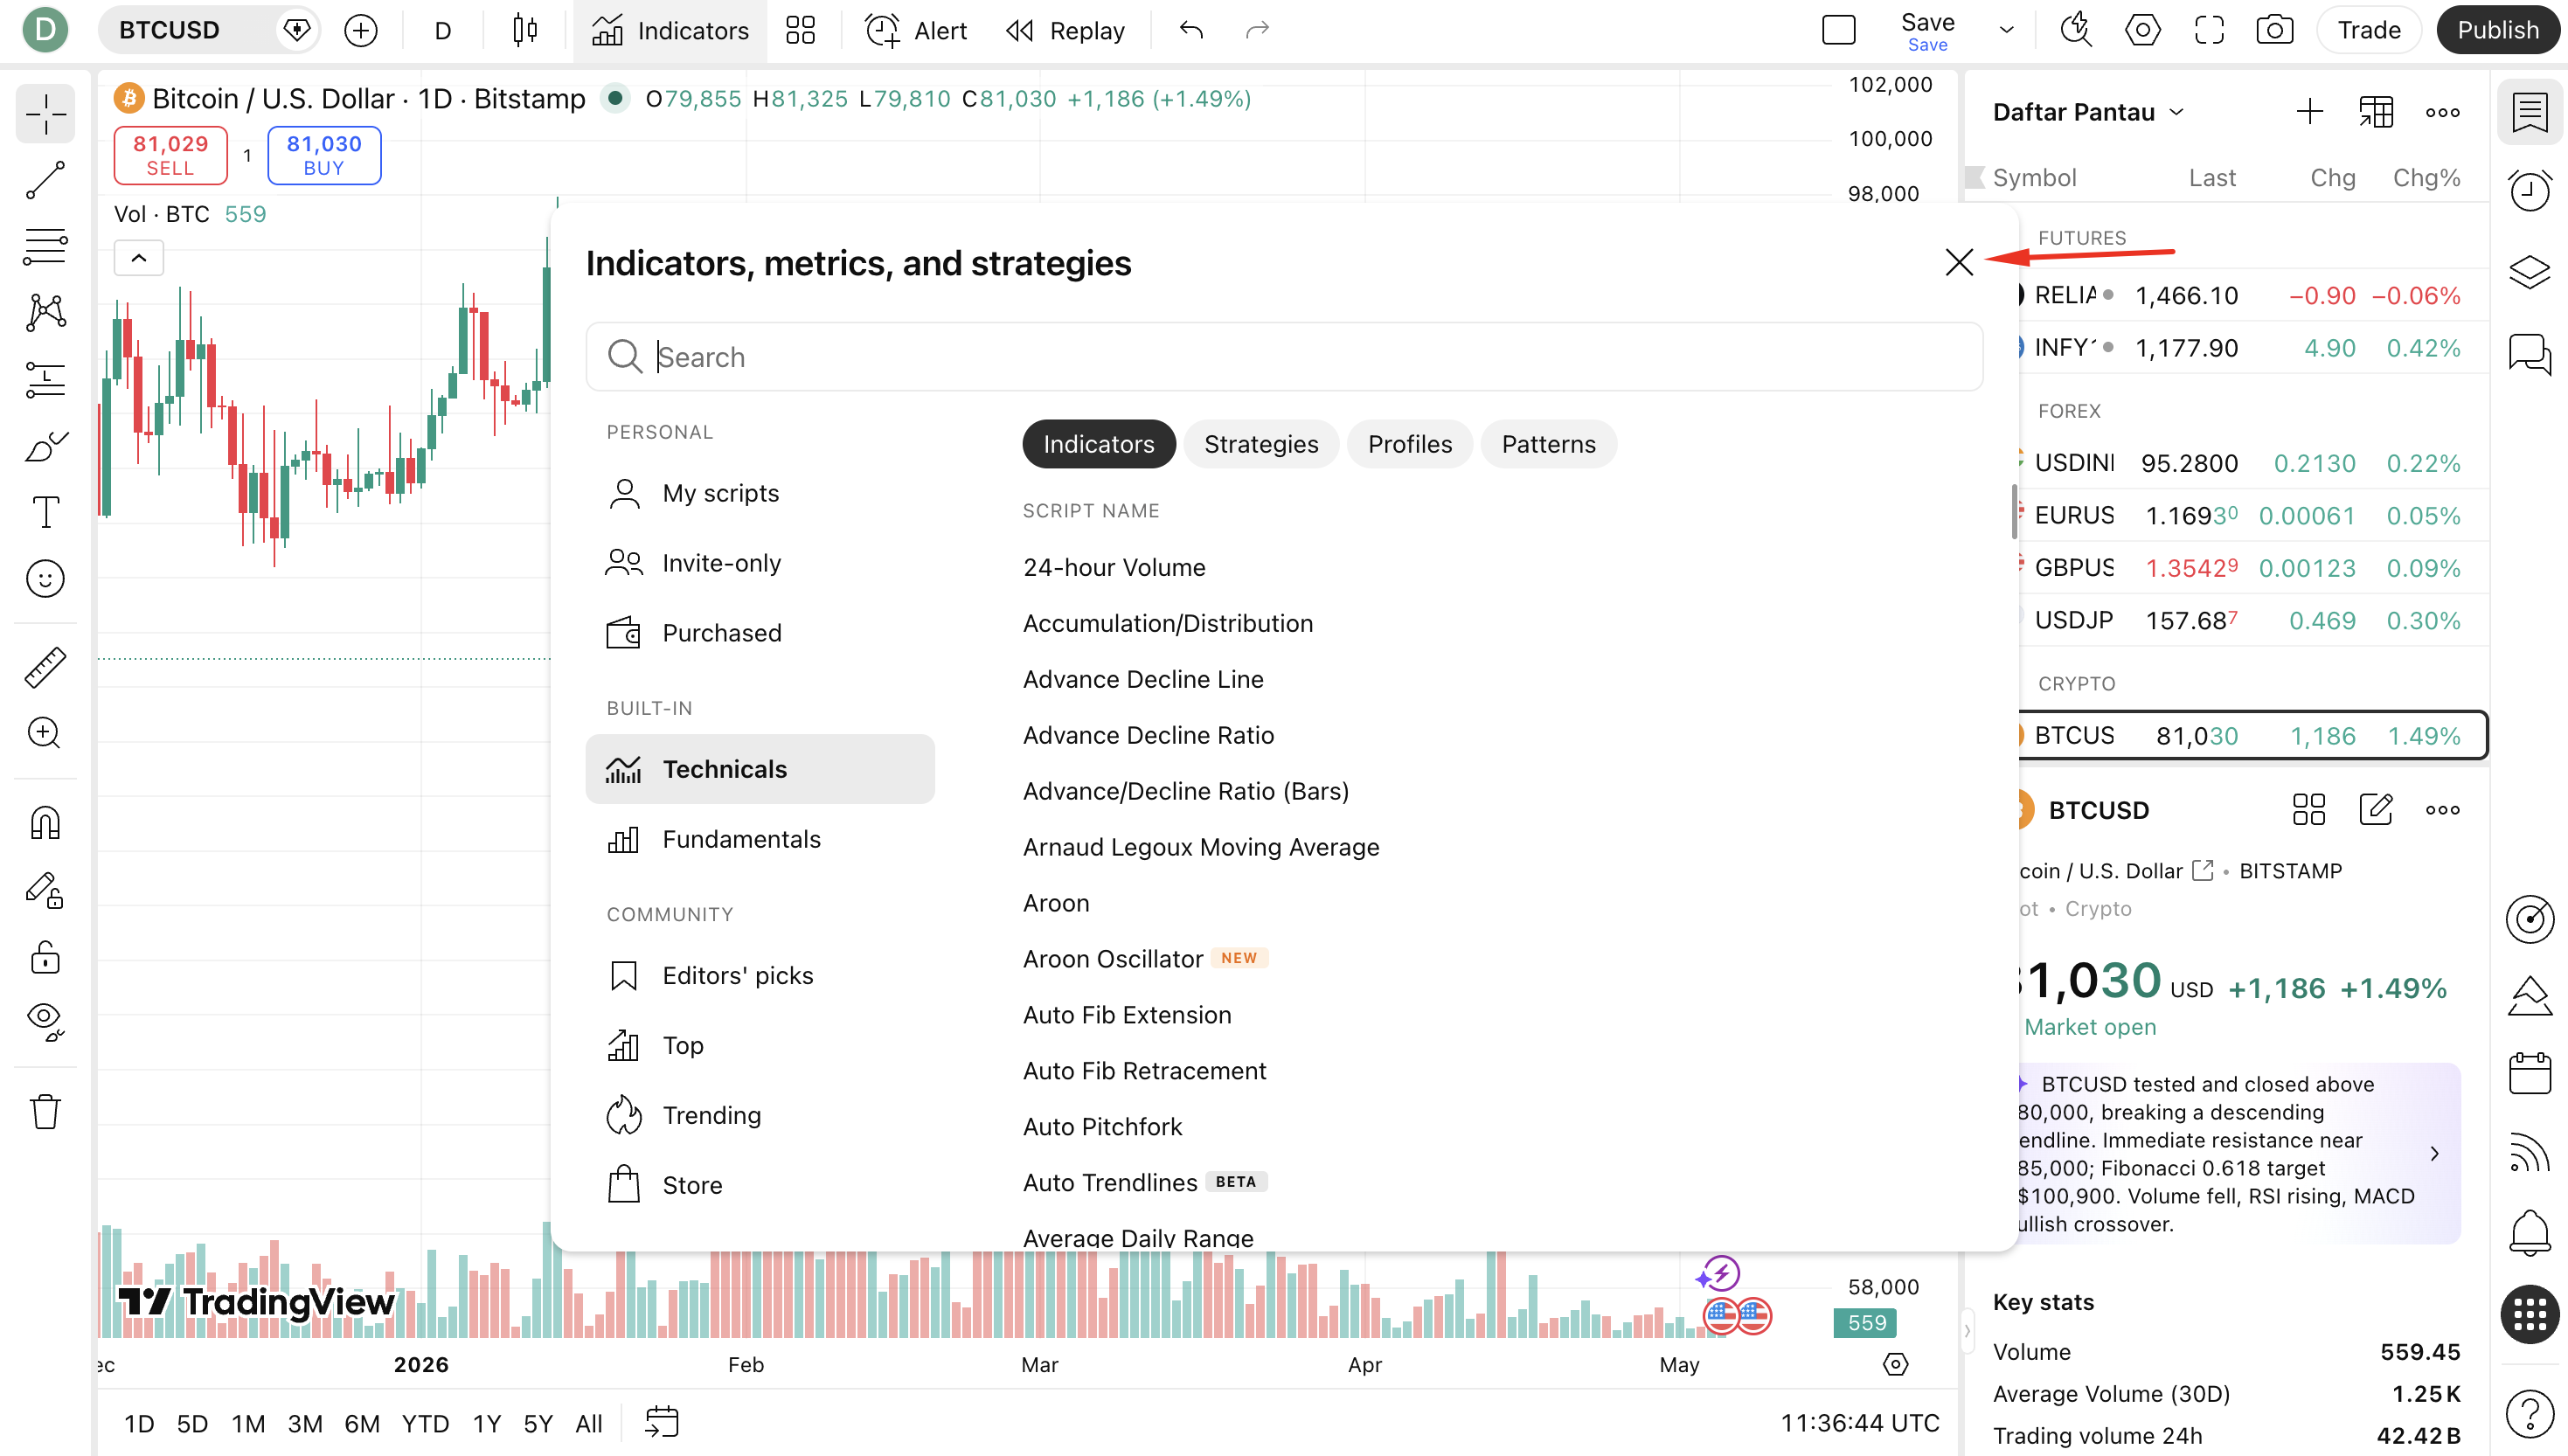
Step 4: Add RSI to Your Chart
- Click on "Relative Strength Index" from the search results.
- The RSI indicator will immediately be added to a new panel below your price chart.
- You will see the RSI line (purple or blue by default) moving between 0 and 100, along with the two horizontal reference lines at 70 (overbought) and 30 (oversold).
- Close the indicator search dialog by clicking the X button or clicking anywhere outside the dialog.
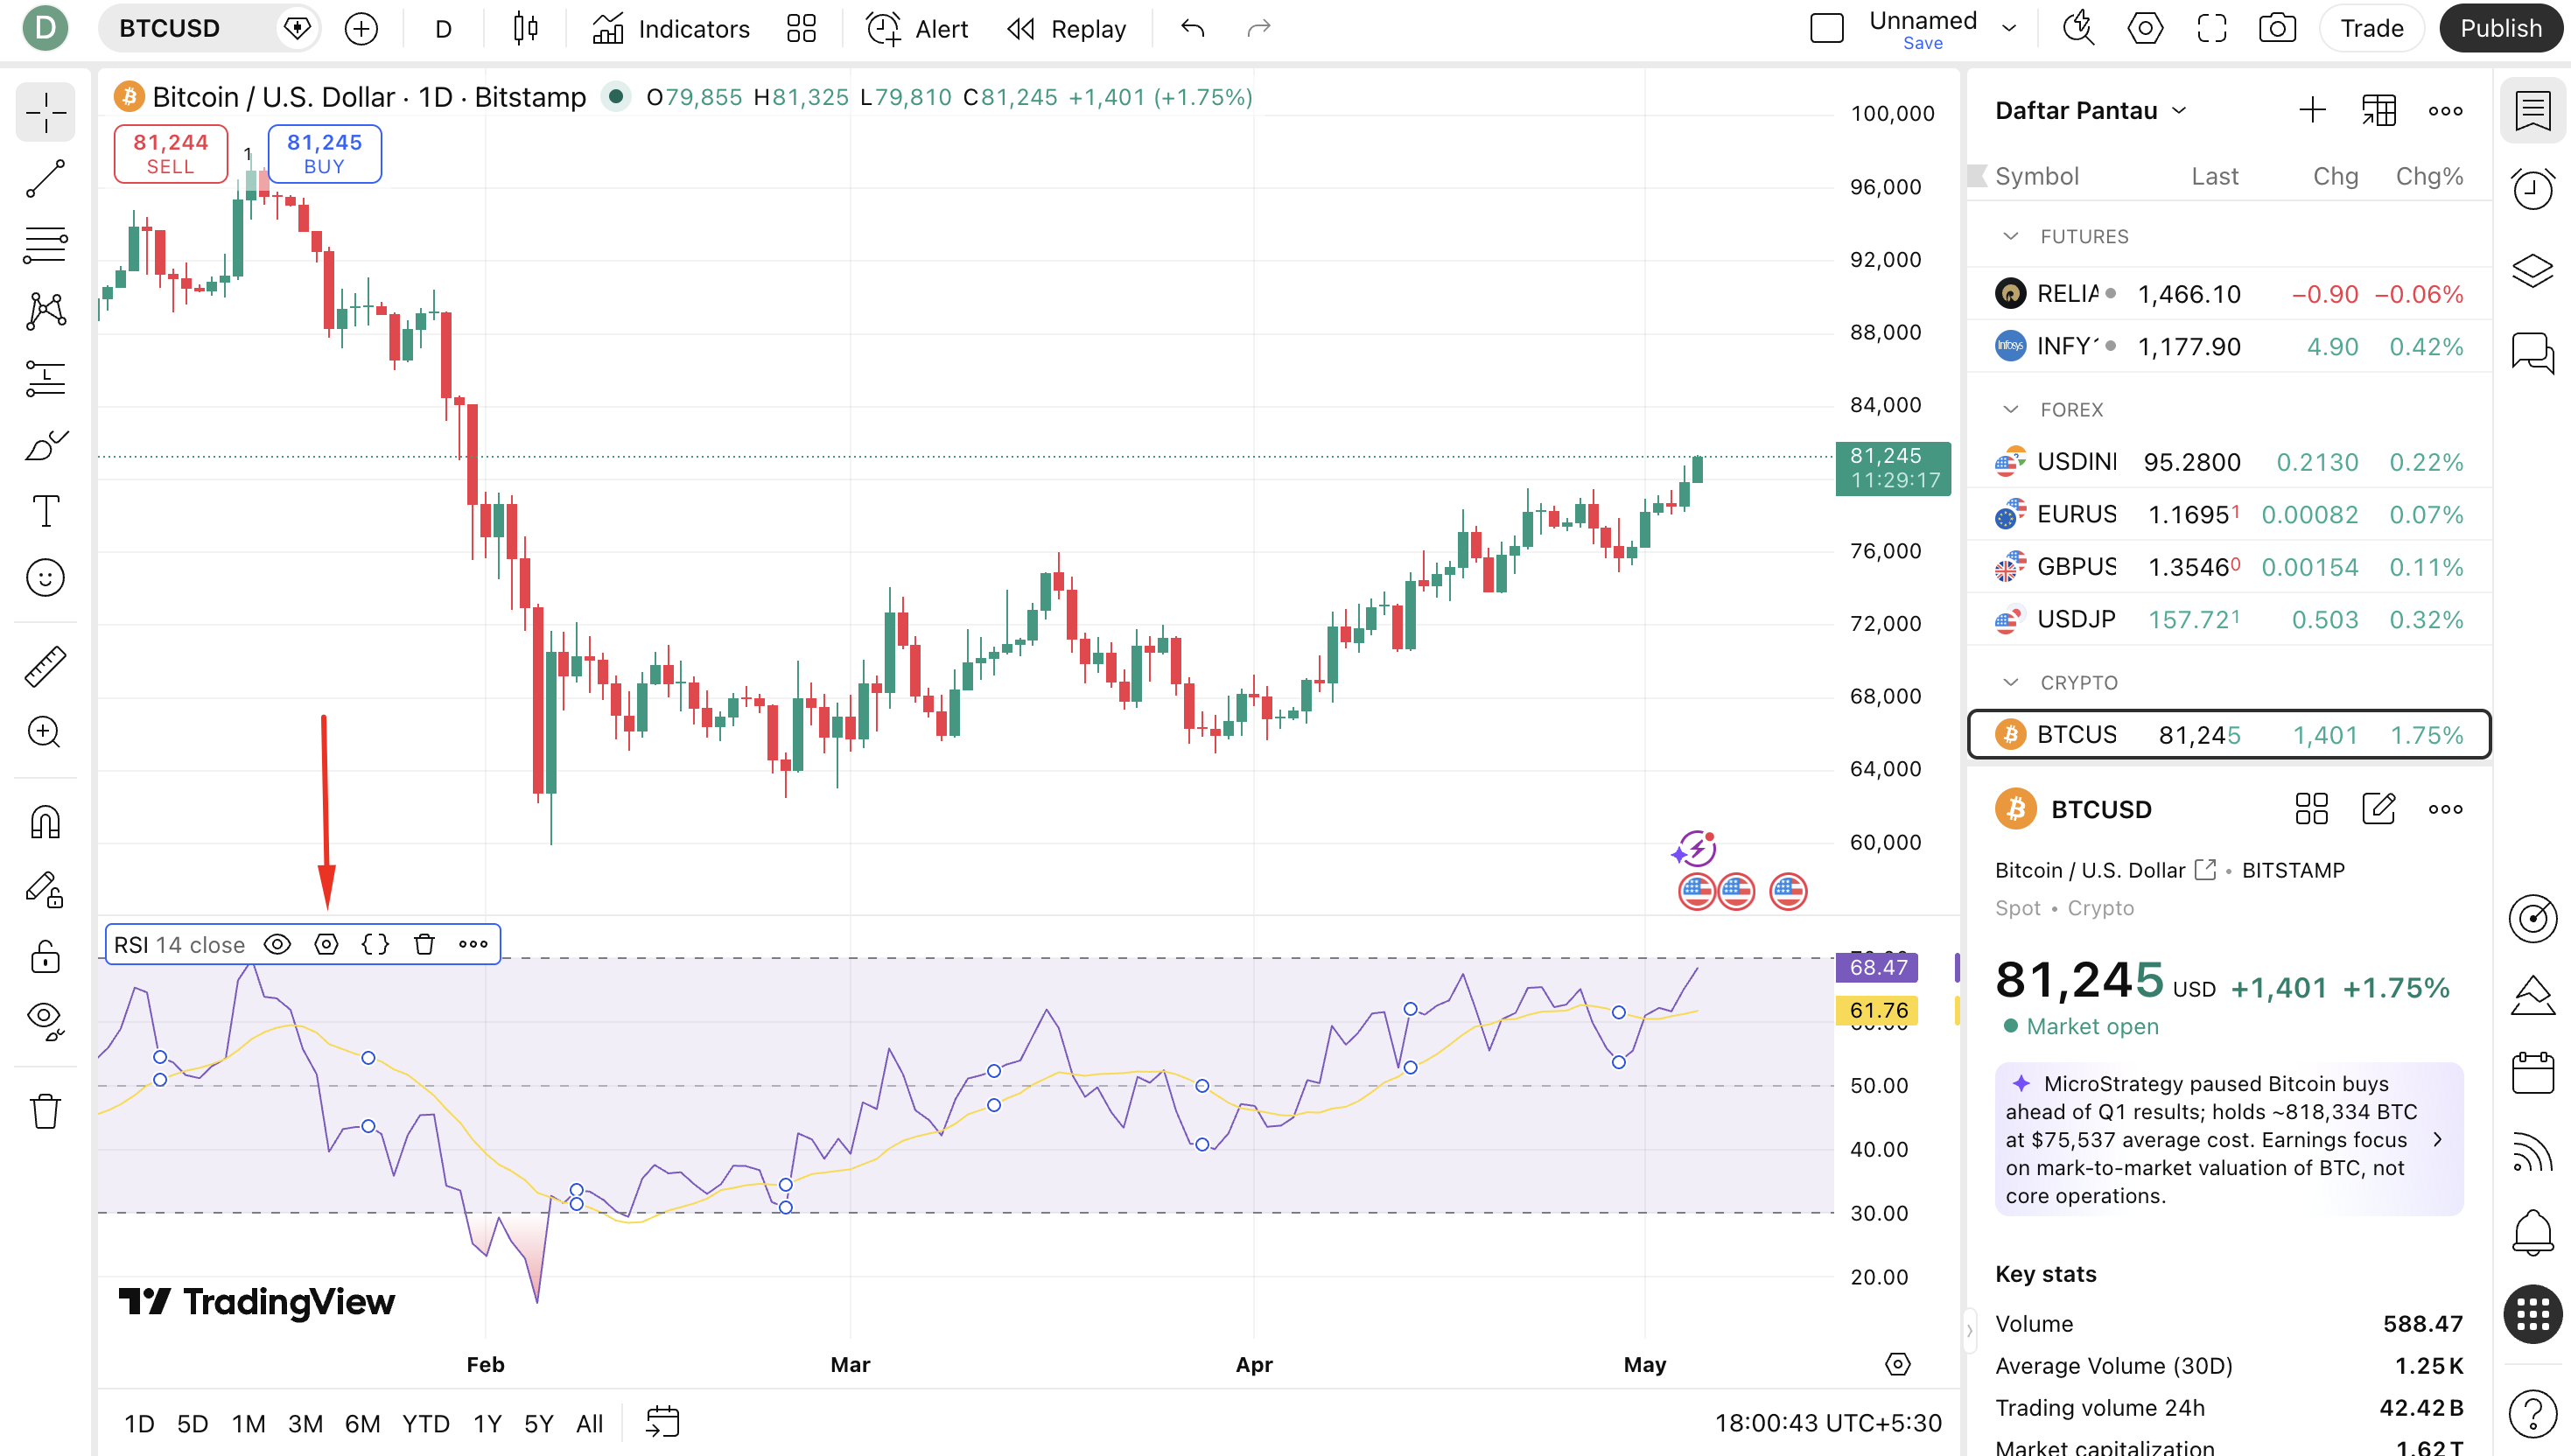
Step 5: Open RSI Settings
- In the RSI panel at the bottom, look at the top-left corner of that panel — you will see the label "RSI (14)".
- Hover your mouse over this label. A small gear icon (⚙) will appear next to it.
- Click the gear icon to open the RSI settings dialog.
- Alternatively, double-click anywhere on the RSI panel to open the settings immediately.
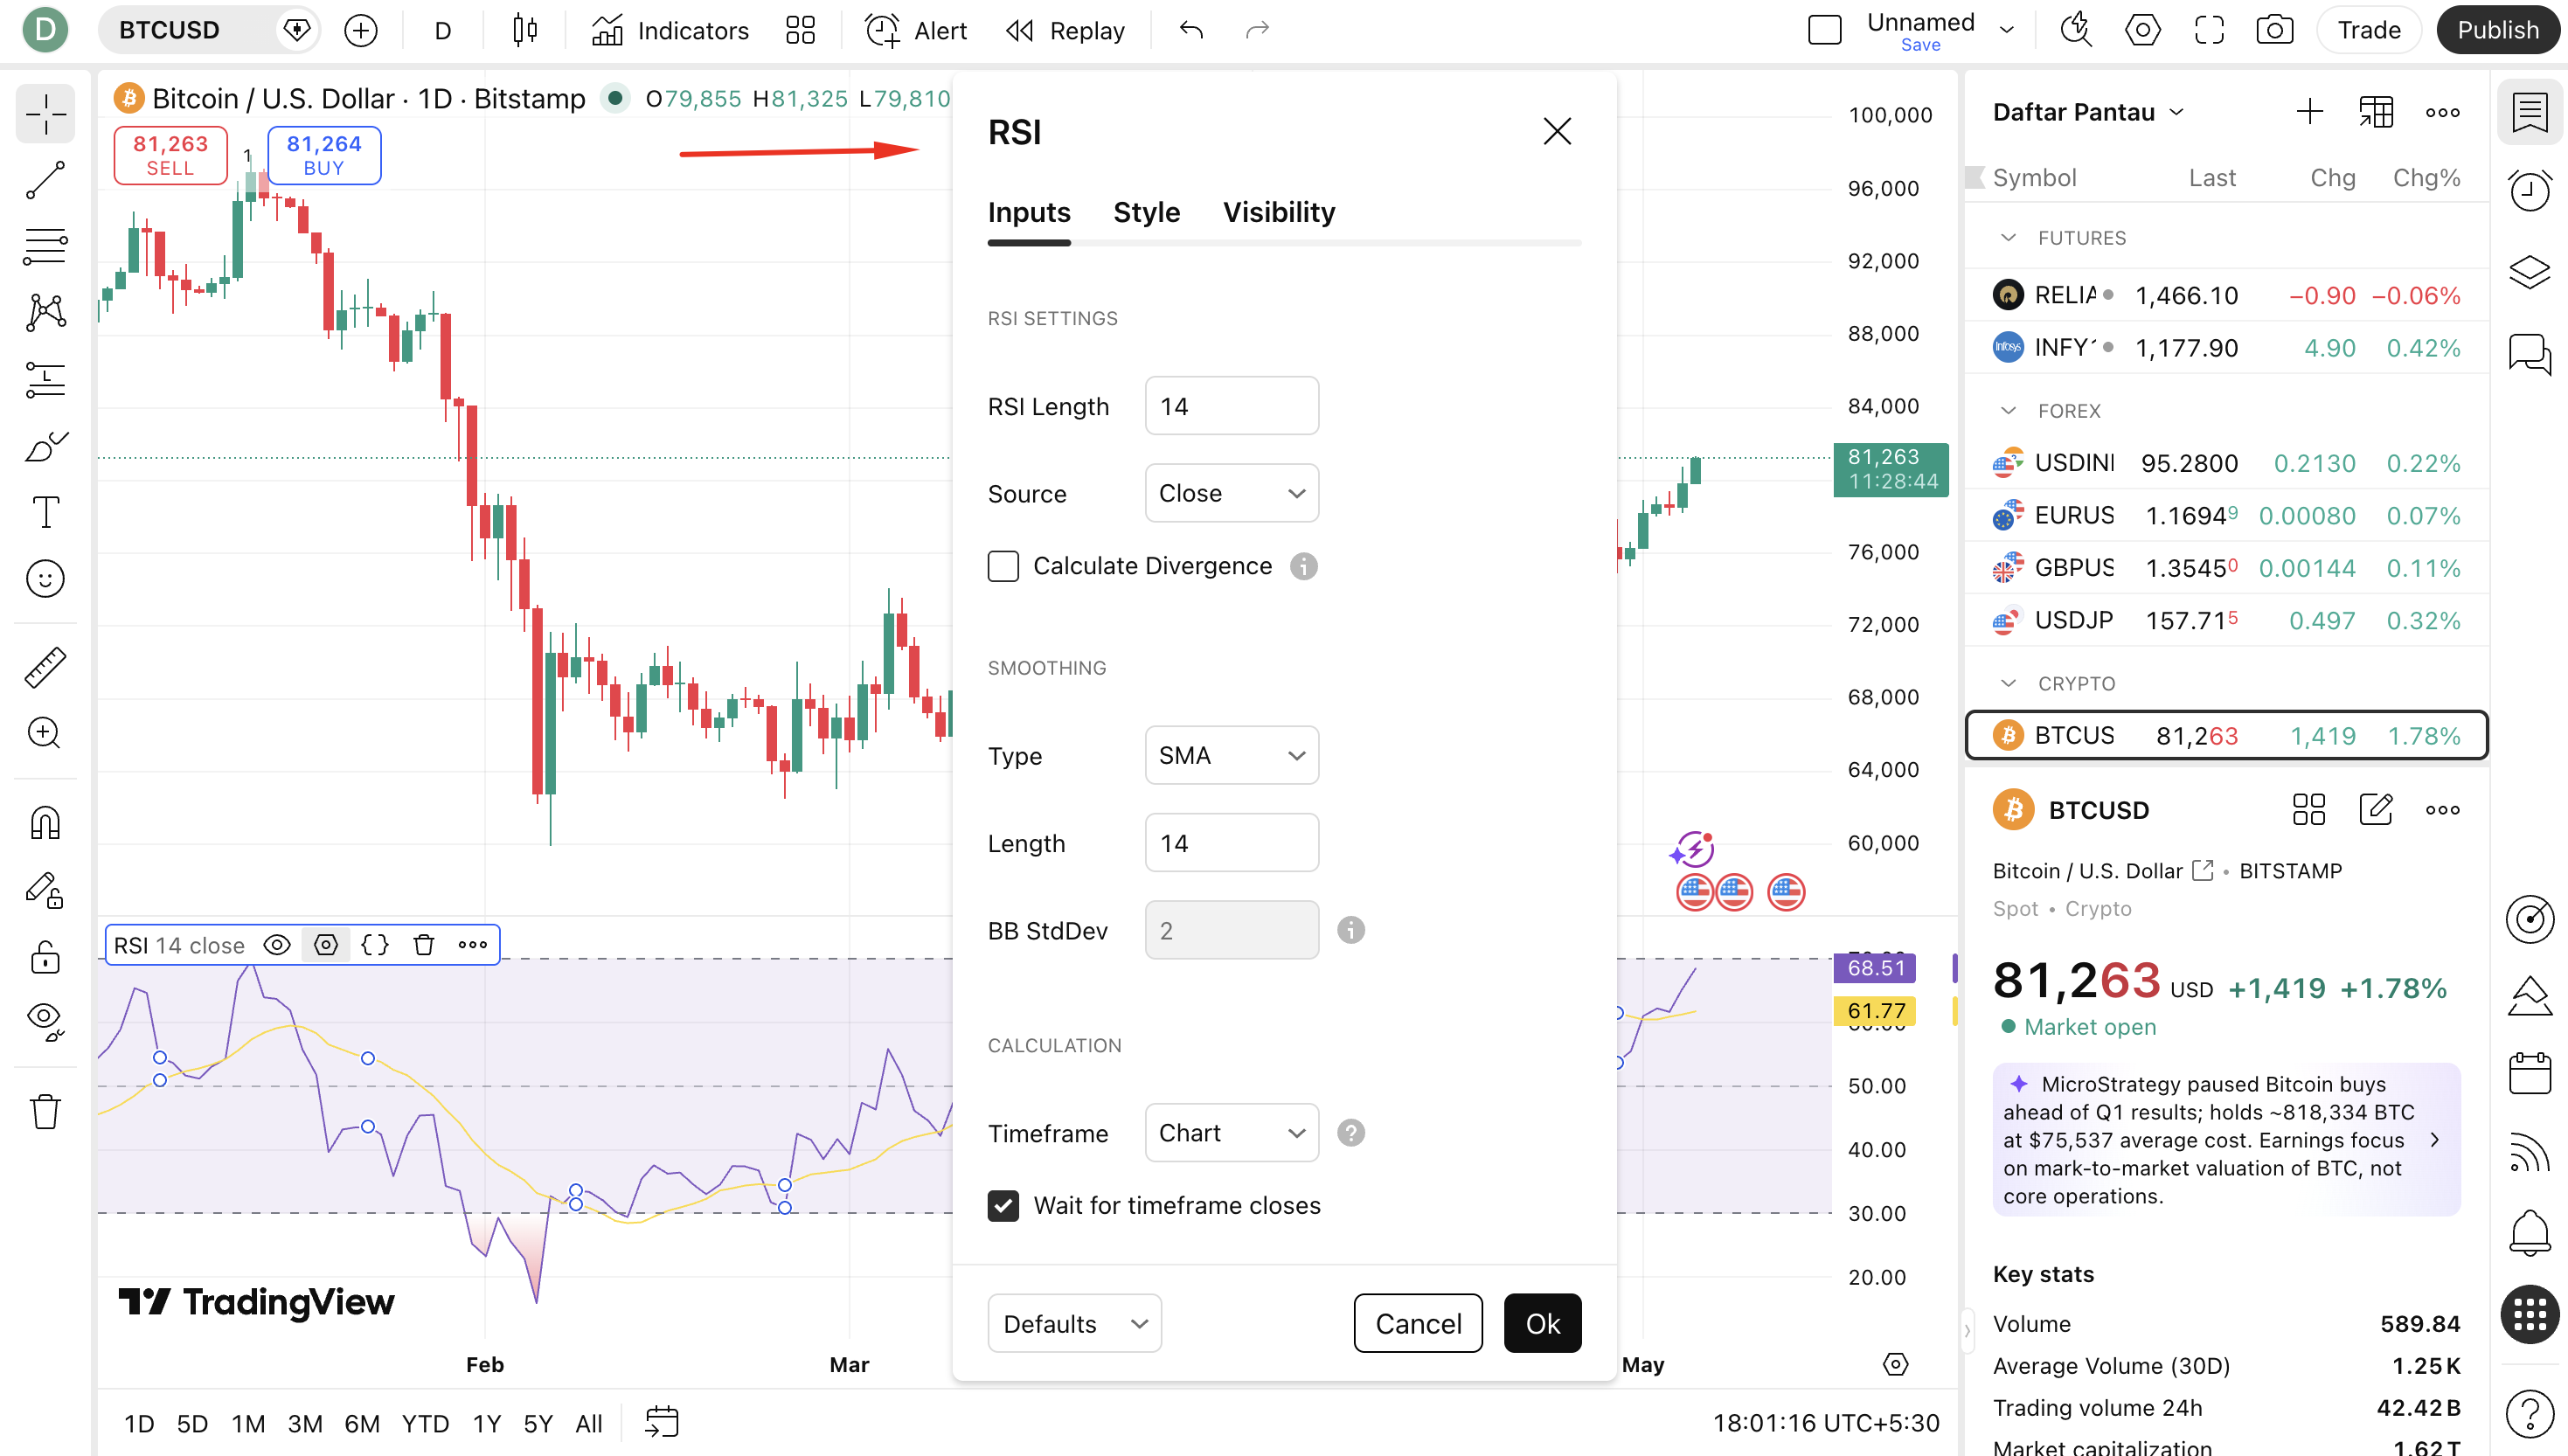
Step 6: Configure RSI Settings
The RSI settings dialog has three tabs: Inputs, Style, and Visibility. Here is what each controls:
Inputs Tab:
- RSI Length: Default is 14. This is the number of periods used in the RSI calculation. Lower values (e.g., 7 or 9) make RSI more sensitive. Higher values (e.g., 21 or 25) make it smoother and slower.
- Source: Default is Close. This is the price data used for the calculation. You can change it to Open, High, Low, HL2, HLC3, or OHLC4 depending on your strategy.
- MA Type: Type of moving average applied for smoothing. Default is RMA (Wilder's smoothing). You can switch to EMA, SMA, etc.
Style Tab:
- Change the color and thickness of the RSI line
- Adjust the overbought line level (default 70) — change to 80 for stronger signals in trending markets
- Adjust the oversold line level (default 30) — change to 20 for stronger signals
- Toggle the midline (50) on or off
- Add background shading between RSI and overbought/oversold levels
Visibility Tab:
- Control which timeframes display the RSI panel (e.g., only show on 1H and above)
Step 7: Add the Midline at 50 (Recommended)
- In the Style tab of the settings dialog, look for the option labeled "Middle Band" or "Basis".
- Enable it and set the value to 50.
- Choose a distinct color (e.g., grey or dashed) so it does not overpower the RSI line visually.
- The 50 midline is invaluable for identifying whether momentum is bullish or bearish at a glance.
Step 8: Apply and Save Your Chart Layout
- Once all settings are configured, click "OK" to apply. The RSI panel updates instantly.
- To save these as permanent defaults for all future charts, click "Set as Default" before clicking OK.
- Save your entire chart layout by pressing Ctrl + S (Windows) or Cmd + S (Mac), or clicking the save icon at the top-right of TradingView.
- Name your layout (e.g., "RSI Setup") so you can load it instantly on any future session.
Quick Reference: TradingView RSI Setup Checklist
| Step | Action | Notes |
|---|---|---|
| 1 | Open TradingView and load a chart | Any symbol and timeframe |
| 2 | Click "Indicators" in the top toolbar | Or press "/" shortcut |
| 3 | Search "RSI" in the dialog | Choose Built-in "Relative Strength Index" |
| 4 | Click RSI to add it to your chart | Appears as a panel below the price chart |
| 5 | Click the gear icon to open settings | Or double-click the RSI panel |
| 6 | Set Length (14), Source (Close) | Adjust overbought/oversold levels if needed |
| 7 | Enable midline at 50 in Style tab | Highly recommended for momentum clarity |
| 8 | Click OK and save layout | Ctrl+S / Cmd+S to save |
RSI Settings and Customization for Different Trading Styles
Standard Settings — Period 14
Wilder's original 14-period setting is the most widely used and provides an excellent balance between sensitivity and reliability. It works best on daily and 4-hour charts for swing traders and position traders.
Faster Settings for Day Traders — Period 7 or 9
Shorter RSI periods react faster to price changes, generating more signals. Period 7 or 9 is popular for day traders on 15-minute to 1-hour charts. These settings are more sensitive but also produce more false signals — use with additional confirmation tools.
Slower Settings for Long-Term Investors — Period 21 or 25
Longer periods smooth out short-term noise and produce fewer, higher-quality signals. Period 21 or 25 is suitable for weekly charts used by investors tracking medium-to-long-term momentum shifts.
Adjusted Overbought/Oversold Levels for Strong Trends
In a strong bull trend, RSI rarely falls below 40 — using the standard 30 oversold level will miss buy opportunities. In this case, adjust the oversold level to 40 and overbought to 80. In a strong bear trend, adjust oversold to 20 and overbought to 60.
| Trading Style | RSI Period | OB Level | OS Level | Best Timeframe |
|---|---|---|---|---|
| Scalping | 7 | 75 | 25 | 1m, 3m, 5m |
| Day Trading | 9 or 14 | 70 | 30 | 15m, 30m, 1H |
| Swing Trading | 14 (Standard) | 70 | 30 | 4H, Daily |
| Position Trading | 21 or 25 | 70 | 30 | Weekly, Monthly |
| Bull Trend Adjusted | 14 | 80 | 40 | Any |
| Bear Trend Adjusted | 14 | 60 | 20 | Any |
Pro Tips for Using RSI Effectively
Tip 1: Use RSI Ranges to Identify Trend Direction
In a bull trend, RSI typically oscillates between 40 and 80 — bouncing off the 40 level instead of reaching 30. In a bear trend, RSI oscillates between 20 and 60 — topping out at 60 instead of 70. Recognizing which range RSI is operating in helps you stay on the right side of the trend and avoid fading strong moves.
Tip 2: Combine RSI With MACD for Double Confirmation
RSI and MACD measure momentum from slightly different angles. When both indicators give the same signal simultaneously — for example, RSI exiting oversold AND MACD showing a bullish crossover — the probability of a successful trade increases significantly. This is one of the most popular multi-indicator combinations in trading.
Tip 3: Do Not Trade Divergence Blindly
RSI divergence can persist for many candles or even weeks before price actually reverses. Always wait for a confirming signal — such as a break of a key support or resistance level, a bullish/bearish engulfing candle, or an RSI crossover of the 50 level — before entering a trade based on divergence alone.
Tip 4: Watch the 50 Level as a Trend Filter
Use RSI's 50 midline as a simple trend filter. Only take long trades when RSI is above 50, and only take short trades when RSI is below 50. This single rule dramatically reduces the number of counter-trend trades and improves win rates.
Tip 5: Avoid RSI in Extreme Trends (It Stays Overbought/Oversold)
During powerful trending moves — such as a crypto bull run or a strong earnings-driven stock rally — RSI can remain above 70 for days or even weeks. In these conditions, selling just because RSI is "overbought" is a costly mistake. Always assess the broader trend before fading RSI extremes.
Tip 6: Use Multi-Timeframe RSI Analysis
Check RSI on both your trading timeframe and one higher timeframe. If the daily RSI is above 50 (bullish) and your 1-hour RSI is exiting oversold (below 30 back above 30), this confluence gives a high-probability long entry in the direction of the larger trend.
Tip 7: RSI Trendlines Work Just Like Price Trendlines
Draw trendlines directly on the RSI indicator just as you would on price. A break of an RSI trendline — especially before price breaks its own trendline — is an early warning signal that is often overlooked by most traders but can be extremely powerful.
Limitations of RSI
1. Lagging in Calculation, Leading in Divergence
Like all indicators based on historical price data, RSI has an inherent lag — it reflects what has already happened. In fast-moving markets, RSI signals may come too late to capture the early part of a move. However, its divergence signal is one of the exceptions where RSI can provide leading (early warning) information.
2. False Signals in Sideways Markets
RSI generates frequent overbought and oversold readings in choppy, range-bound markets where there is no clear trend. These signals often lead to losing trades if taken without additional context. In ranging conditions, RSI works better as a mean-reversion tool than a trend entry tool.
3. Overbought Does Not Mean Sell — Oversold Does Not Mean Buy
This is the most common RSI mistake made by beginners. In strong uptrends, RSI can remain above 70 for extended periods while price continues to climb. In strong downtrends, RSI can stay below 30 while price keeps falling. Always assess the trend context before acting on RSI extremes.
4. Different Assets Need Different Thresholds
Highly volatile assets like cryptocurrencies may rarely reach traditional overbought/oversold levels on daily charts, while low-volatility assets may hit them frequently. The default 70/30 levels may need adjustment depending on the asset's historical RSI behavior.
5. Not a Standalone System
RSI alone is not a complete trading system. It must be used in conjunction with trend analysis, support and resistance levels, volume, and price action to produce reliable, actionable signals.
Conclusion
The Relative Strength Index remains, nearly five decades after its creation, one of the most powerful and insightful tools available to traders and investors. J. Welles Wilder's elegant formula — measuring the ratio of average gains to average losses over time — produces a single line that encapsulates a wealth of information about market momentum, trend strength, and potential turning points.
From simple overbought and oversold readings to sophisticated divergence analysis and failure swings, RSI offers something valuable to traders at every level of experience. The key is understanding not just the signals it generates, but the context in which those signals occur — the trend direction, the timeframe, the market condition.
Whether you are a day trader looking for precise entries on 15-minute charts, a swing trader hunting for high-probability setups on daily charts, or a long-term investor monitoring momentum on weekly charts, RSI belongs in your analytical toolkit.
Start with the default 14-period RSI on TradingView, add the midline at 50, and spend time observing how RSI behaves at different levels across different market conditions. With practice, you will find that RSI becomes one of the most reliable and intuitive tools in your entire trading arsenal.
Frequently Asked Questions
What are the default RSI settings?▼
The default RSI setting is a 14-period length with overbought at 70 and oversold at 30. These were the original parameters set by Wilder and remain the most widely used settings across all markets and timeframes.
What does it mean when RSI is below 30?▼
When RSI falls below 30, the asset is considered oversold — meaning recent price declines have been unusually sharp and a bounce or reversal may occur. The actual buy signal is when RSI crosses back above 30, not simply when it drops to 30.
What is RSI divergence?▼
RSI divergence occurs when the price chart and RSI move in opposite directions. Bullish divergence: price makes a lower low but RSI makes a higher low — signals weakening bearish momentum and a likely reversal upward. Bearish divergence: price makes a higher high but RSI makes a lower high — signals fading bullish momentum and a likely reversal downward. Divergence should always be confirmed with price action before trading.
Can RSI be used for all financial markets?▼
Yes. RSI is universal and works across stocks, forex, cryptocurrencies, commodities, indices, and ETFs. It also adapts to any timeframe — from 1-minute to monthly charts. However, highly volatile assets like cryptocurrencies may require adjusted overbought/oversold levels (e.g., 80/20 instead of 70/30) to account for their larger price swings.
Related Blogs

MACD Indicator: The Complete Guide — History, How It Works & TradingView Setup
A professional, in-depth guide to the MACD indicator — covering its history, how it works, signals it generates, and a step-by-step walkthrough to add and configure MACD on TradingView with screenshots.

Moving Average Indicator: The Complete Guide — SMA, EMA, WMA, VWMA & TradingView Setup
A professional, in-depth guide to Moving Average indicators — covering the history, types (SMA, EMA, WMA, VWMA, DEMA, TEMA, HMA), how each works, trading signals, and a full step-by-step walkthrough to add and configure Moving Averages on TradingView.