How Data Analysis Is Used in Formula 1: A Complete Guide for Fans
How data analysis is used in Formula 1: from sensors and telemetry to tyre strategy, pit stops, car design, driver performance, and race day decisions. A complete, simple guide for F1 fans.
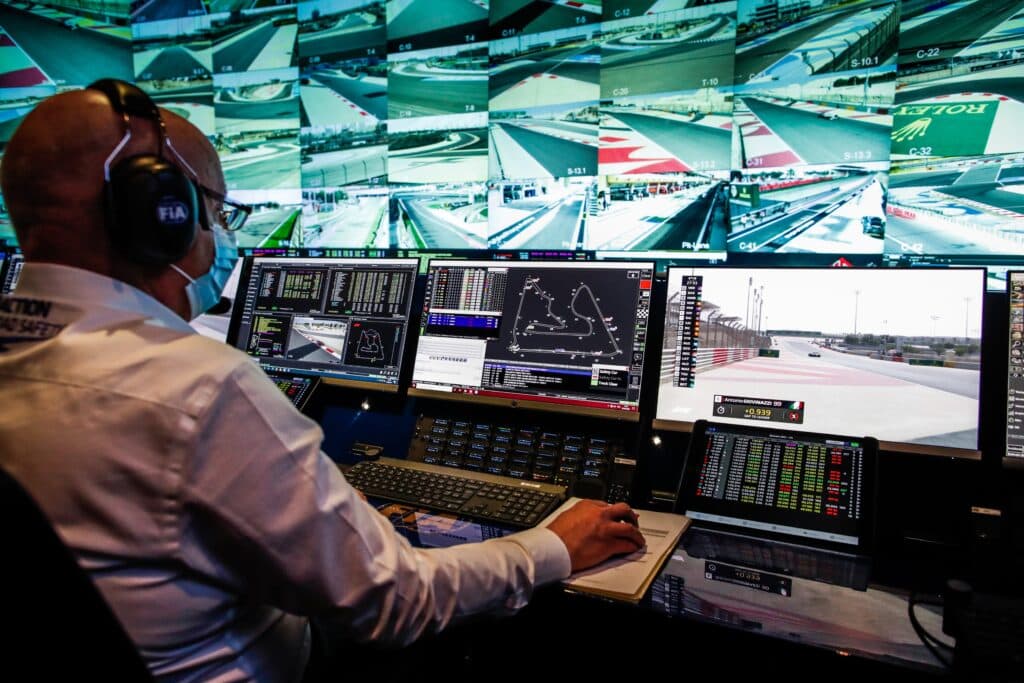
The Sport We All Love
We all love watching Formula 1. The beautiful cars. The amazing tracks. The fight for the championship. It is easy to think that F1 is only about who has the fastest car and the bravest driver.
But look a little deeper and you will see that F1 is a mix of four big things: the fastest cars, great teamwork, smart strategy, and data analysis. The first three are easy to see on TV. The fourth one mostly happens out of sight, in the garage, on the pit wall, and in the factory. And it may be the part that connects everything else.
In this blog, we explain in simple words how data analysis is used in F1, and why modern teams cannot win without it.
Why Data Matters So Much in F1
In F1, the difference between winning and finishing second can be a fraction of a second. At those margins, guessing is not enough. Teams need to know exactly what the car is doing, what the tyres are doing, and what the rivals are doing, all the time.
Data gives teams that knowledge. It helps them answer questions like these:
- Is the car set up well for this track?
- How fast are the tyres wearing out?
- When is the best lap to pit?
- Where is the driver losing time in a corner?
- Is a part about to fail?
- What will rivals probably do next?
Every one of these questions can be answered better with data than with a feeling.
Where Does All This Data Come From?
An F1 car is covered in sensors. Each car has hundreds of them, and together they send thousands of readings every second. They measure almost everything that happens in the car.
| What Is Measured | Examples |
|---|---|
| Driver inputs | Throttle, brake pressure, steering angle, gear |
| Car movement | Speed, position by GPS, acceleration, how hard the car turns |
| Tyres | Temperature, pressure, wear |
| Engine and power unit | Temperatures, pressures, fuel use, energy recovery and use |
| Brakes | Disc temperatures and wear |
| Aerodynamics | Air pressure around the car and how much downforce it makes |
| Suspension | How the springs and dampers move over bumps and kerbs |
Data also comes from outside the car:
- Weather: Rain chance, wind, air temperature, and track temperature
- Timing data: Lap times and sector times for every car on track
- Track data: How the surface grip changes during the weekend
- Past races: Years of earlier results, tyre use, and strategies at the same circuit
Telemetry: The Car Talks to the Pit Wall
Telemetry means sending data from the car to the team while it is driving. As the car goes around the track, the numbers are sent by radio to the garage, and often to the team's factory too.
Engineers watch screens that show the car's data in real time. They can see when a driver brakes, how much throttle they use, how hot the tyres are, and whether the engine is healthy. It is like a doctor watching a heart monitor, but for a car.
This also means that engineers back at the factory can help during the race. They can run extra checks and simulations and send advice to the pit wall while the race is happening.
How Data Is Used in F1
1. Designing and Developing the Car
A fast car does not come by luck. Teams use computer simulations of airflow, wind tunnel tests, and track data to design new parts. After a new part is added to the car, the team compares track data with what the simulations predicted. If the numbers do not match, they find out why and fix their models. This loop of design, test, measure, and improve never stops during the season.
2. Setting Up the Car for Each Track
Every track is different. Some need a lot of downforce for slow corners. Others need low drag for long straights. During practice sessions, teams try different settings, such as wing angles, ride height, and suspension, and use data to see what works. By the end of practice, they want a setup that gives the driver confidence and speed.
3. Managing the Tyres
Tyres are one of the most important parts of strategy. As a tyre is used, it wears out and loses grip. This is called tyre degradation. Teams track tyre temperature, wear, and lap times to see how fast a tyre is losing performance.
With this data, they can answer important questions. How many laps can this tyre last? When will the grip drop sharply? Is it better to protect the tyres now or push harder? In dry races, the rules usually require using more than one type of tyre, so planning the tyre order is a key part of strategy.
4. Pit Stop Strategy
A pit stop itself takes only a couple of seconds, but the decision of when to stop can decide a race. Teams think about tyre wear, gaps to cars ahead and behind, traffic in the pit exit, and the weather.
Two famous ideas are the undercut and the overcut:
- Undercut: Pit earlier than the rival. Fresh tyres give you faster laps, and when the rival stops later, you may come out ahead.
- Overcut: Stay out longer. If the track is clear and your tyres are still good, you can set fast laps while the rival loses time in traffic after their stop.
Which one works depends on the track, the tyres, and the traffic. Data and simulations help teams decide, and the choice can change from one lap to the next.
5. Race Simulations and Probabilities
Before and during a race, teams run simulations of how the race might go. They try different pit stop laps, tyre choices, safety car chances, and weather. Often they run the same race thousands of times with small random changes. This gives them probabilities. For example, one plan may win more often, while another plan is safer.
This is why a strategy call is not just a guess. The team is choosing the option that gives the best chances across many possible race stories.
6. Understanding the Driver
Data also shows what the driver is doing, lap by lap. Engineers compare two laps, or two drivers, by looking at traces of speed, throttle, braking, and steering. They can see exactly where one lap is faster. Maybe the driver brakes a little later in turn 3 or gets on the throttle earlier out of turn 7.
This helps drivers improve and helps the team understand how to adjust the car to suit each driver. It also helps in comparing teammates fairly, because the numbers show where the differences really are.
7. Keeping the Car Reliable and Safe
If a part fails during a race, the race can be over. Teams watch temperatures, pressures, vibrations, and wear to spot problems early. If a number starts to drift in the wrong direction, the engineer may ask the driver to change settings, lift off, or save the engine to get to the end of the race. Data analysis also helps teams plan which parts to replace and when, before they fail.
8. Energy, Fuel, and Power Management
Modern F1 cars use a complex power unit and have limits on fuel and energy. Teams use data to plan how and where to use power on every lap. Using too much too early can leave the car short later. Good energy management can mean extra speed in the right places, like defending a position or attacking on a straight.
9. Weather and Track Changes
Weather can change a race in minutes. Teams use weather radar and forecasts, together with track temperature data, to guess when rain may start and which tyres will be needed. They also watch how grip builds up as more cars run on the track. Having the right information early can mean making the right tyre call before rivals do.
10. Studying Rivals
Teams do not only study their own cars. They also look at their rivals' lap times, tyre use, and pit stop timing. They compare long-run pace to see who is strong at the end of a stint, and they look for patterns in how rivals react. This helps them predict rival strategies and prepare an answer.
11. Pit Stops and Pit Crew Performance
Fast pit stops come from practice and measurement. Teams record every stop and study each step, such as wheel gun time, jack timing, and release. Small improvements add up, and top stops now take only about two seconds. Data helps the crew find which step can still be made faster.
12. Simulators
Teams also use driving simulators at their factories. Engineers load real track data into the simulator, then test setups and strategies without using a real car. Drivers can practice a track, test new parts, and prepare for different conditions. The simulator results are then compared with real data from the track, and the models get better over time.
A Race Weekend Seen Through Data
| Stage | How Data Is Used |
|---|---|
| Before the weekend | Teams study past races, simulator results, and weather forecasts for the track |
| Practice sessions | Try setups, test tyres, and measure tyre wear over long runs |
| Qualifying | Compare lap traces to find time, and choose the best tyre and timing for a fast lap |
| Race start | Check tyre temperatures, brake temperatures, and the plan for the first stint |
| During the race | Watch tyre wear, gaps, traffic, weather, and car health, and update the strategy |
| Safety car or rain | Rerun options quickly and decide whether to pit or stay out |
| After the race | Review every decision and lap to learn and improve before the next race |
The People Behind the Data
Behind every F1 car is a group of people who work with data. Some common roles are:
- Race strategy engineer: Plans pit stops and tyre choices and decides what to do when the race changes
- Performance engineer: Studies the car's data and works with the driver to improve lap time
- Data scientist or analyst: Builds models and tools that turn large amounts of data into clear answers
- Simulation engineer: Builds and runs the simulations used for design and strategy
- Reliability engineer: Watches the health of the parts and plans how long they can last
Many of these people use tools like Python, SQL, and MATLAB, along with special telemetry software made for racing.
How Fans Can Explore F1 Data
You do not need to work for a team to enjoy F1 data. During races, official timing screens and race graphics show gaps, lap times, and tyre information. There are also free tools that let fans explore public timing and lap data. For example, FastF1 is a popular Python library that lets you compare drivers, lap times, and tyre stints from past races.
A fun way to start is to pick one race and ask a simple question, like which driver had the best pace on old tyres. Then look at the lap times to find out. It is a great way to learn data analysis while watching the sport you love.
What Data Cannot Do
Data is powerful, but it does not win races alone.
- The driver still matters. Data can show where time is lost, but the driver still has to deliver it on track.
- Racing is unpredictable. A crash, a safety car, or sudden rain can break the best plan.
- Models are not perfect. A simulation is only as good as the data and assumptions behind it.
- Too much data is hard to use. The skill is in finding the few numbers that matter right now.
- People make the final call. Strategists, engineers, and drivers must decide quickly and take responsibility.
The best teams are the ones that mix good data with good judgment and clear communication.
What Other Fields Can Learn From F1
The F1 way of working is useful far beyond racing. The same ideas help in many areas, such as business, healthcare, and logistics:
- Collect the right data in real time
- Test ideas in simulation before you try them for real
- Check every decision after the event and learn from it
- Use data to help people decide, not to replace them
- Keep improving in small steps, every single time
The Bottom Line
F1 is a mix of the fastest cars, great teamwork, smart strategy, and data analysis. Sensors turn every lap into numbers, telemetry sends them to the team live, and engineers use them to set up the car, manage tyres, time pit stops, understand drivers, protect the engine, and beat rivals. Data does not replace the thrill of racing or the skill of the drivers. It makes every decision sharper. Next time you watch a pit stop or a strategy call, remember that behind that moment there are thousands of numbers and a team of people turning them into a win.
Frequently Asked Questions
How is data used in Formula 1?▼
F1 teams collect data from hundreds of sensors on the car and from the track, the weather, and rival cars. Engineers use this data to set up the car, manage tyres, plan pit stops, understand driver performance, design new parts, and catch problems before they cause a failure.
What is telemetry in F1?▼
Telemetry is the live stream of data sent from the car to the team while it is driving. It shows things like speed, throttle, braking, tyre temperatures, engine health, and fuel use, so engineers in the garage and at the factory can watch the car in real time.
How do teams decide when to make a pit stop?▼
Teams combine tyre wear data, lap times, traffic on track, weather, and what rivals are doing. They run simulations to compare options, such as stopping early or staying out longer, and pick the plan most likely to give the best result. Events like a safety car can change the plan very quickly.
What are the undercut and the overcut?▼
An undercut means pitting earlier than a rival so that fresh tyres give you faster laps while they are still on old tyres. An overcut means staying out longer and using clear track to set fast laps while the rival is stuck in traffic after their stop. Data helps teams decide which one will work.
Related Blogs

What Is Quant Engineering? Roles, Skills, Tools and How to Start
A short, simple guide to quant engineering: what it is, what quant engineers build, the skills and tools they use, how it differs from other quant roles, and how to start learning it.
What Is a RAG Pipeline? How AI Combines Pretrained Knowledge With Your Own Documents
What a RAG pipeline actually is and how it works: how an AI system combines its own pretrained knowledge with your own documents, PDFs, or research papers to give more accurate, source-grounded answers.